

Second Quarter Market Recap
In the second quarter of 2024, the U.S. economy stayed resilient in an environment where inflation and interest rates remained higher than expectations. Tighter monetary policy was offset by accommodative fiscal policy, and a still-strong U.S. consumer.
The S&P 500 Index was up 4.3% in the quarter, reaching a new all-time high. The gains came with some volatility in the three-month period. The S&P fell 4.1% in April, pressured by a stronger-than-expected March inflation report and rising bond yields. In May and June, stocks rebounded, led by technology stocks. Chip-maker Nvidia became the world’s most valuable company in late June after its share price climbed to an all-time high, making it worth $3.34 trillion, with its price nearly doubling since the start of this year. We also saw the continuing trend of large-cap stocks outperforming small-cap stocks and growth beating value.
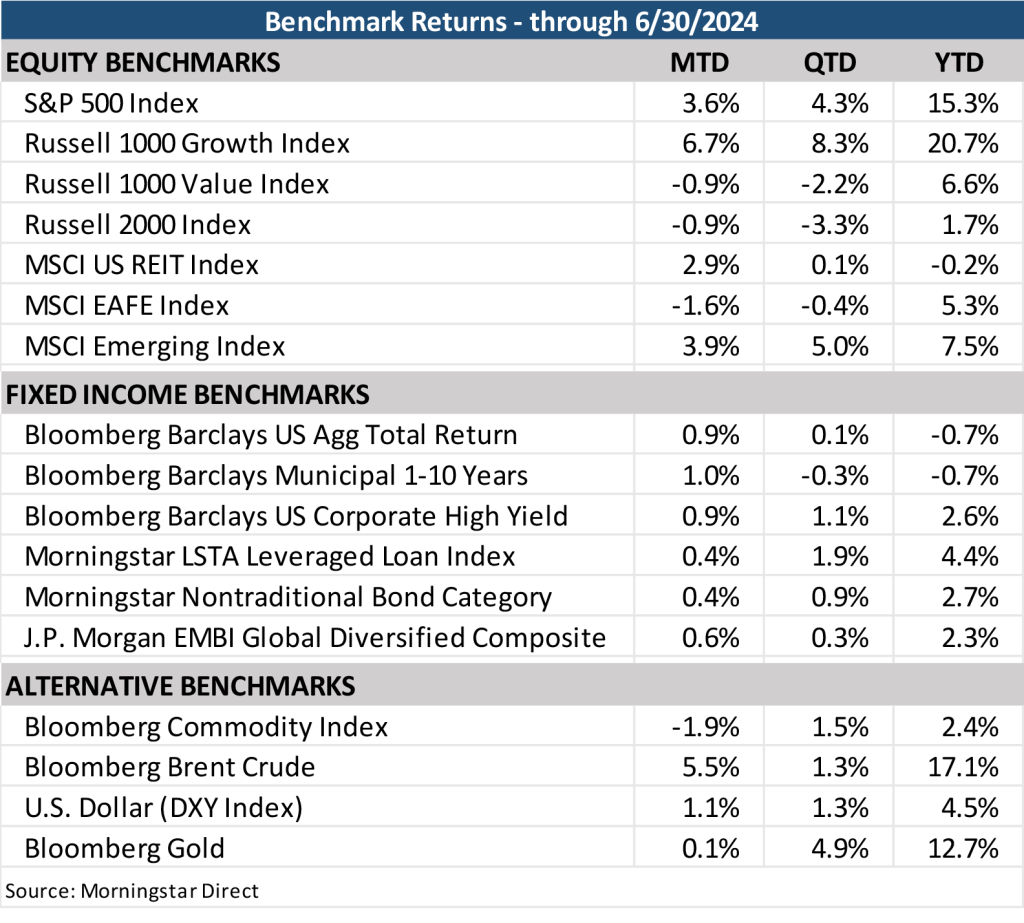
Overseas, results were mixed with developed international stocks falling 0.2%, while emerging markets stocks rose 5.0% for Q2 2024.
Within the bond markets, returns were positive across most fixed-income segments. The benchmark 10-year Treasury yield ended the quarter close to where it started, but rates were volatile in the period. The 10-Year Treasury started at 4.20%, rose to 4.70% before coming back to the mid-4.20% range. In this environment, the Bloomberg U.S. Aggregate Bond Index was flat, and credit performed well in the quarter as high-yield bonds were up 1.1% in the quarter.
Overall, economic and corporate fundamentals remained relatively healthy in the quarter, and the next move for the Fed Funds rate is likely to be lower, even if the cuts are taking longer than expected.
Macroeconomic and Investment Outlook
During the second quarter, the U.S. economy began its fifth year of expansion after the brief pandemic-related recession in April 2020. Ongoing economic growth has defied widespread expectations of a recession that were present for most of 2023. Recession concerns were due to the Fed’s rapid and meaningful increase in interest rates, resulting in an inverted yield curve (historically a good predictor of recession) and the potential negative impact this would have on the economy. As we laid out in our fourth-quarter 2023 commentary, our view was that given the current level of inflation, Fed policy seemed to be on the border between being accommodative and restrictive.
Our view on Fed policy is largely based on the level of the real Fed Funds rate (Fed Funds rate minus inflation, shown in blue) and prior recessions. (We use the Personal Consumption Expenditures Index, or PCE, the Fed’s preferred inflation metric.) In the chart below, the green line shows the shape of the Treasury curve, with points above zero indicating a normally (upward) sloped yield curve and below zero representing an inverted (downward sloped) yield curve. The vertical grey bars indicate a recession.
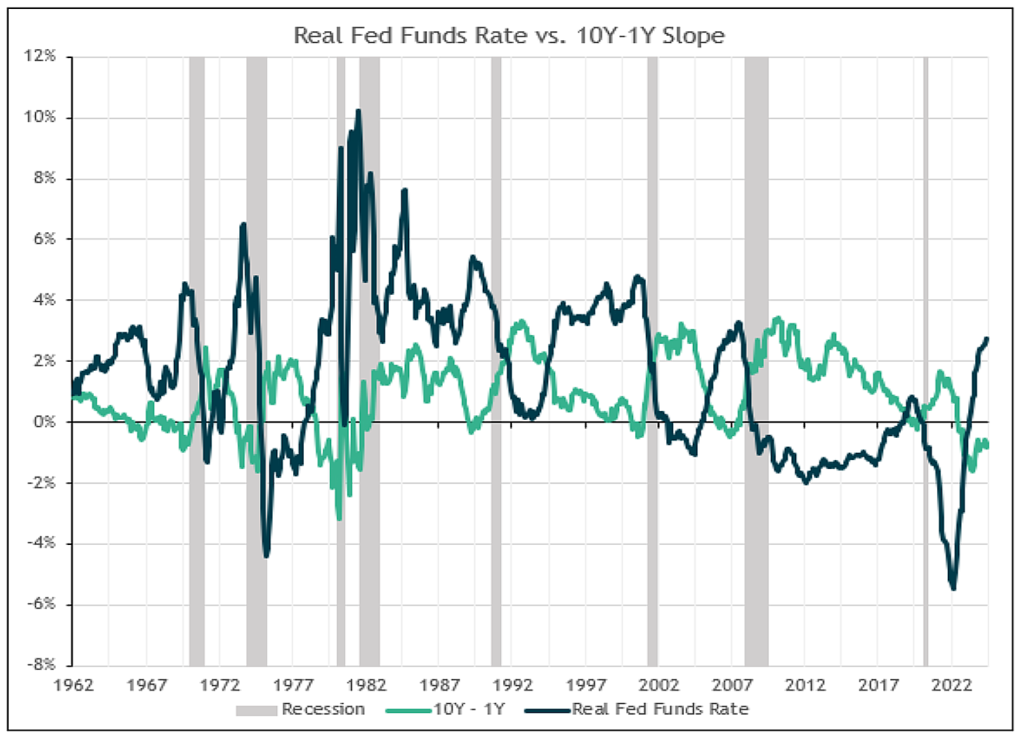
We can see that while the yield curve has been inverted since July 2022, Fed policy was very accommodative for most of that time, i.e., the real Fed Funds rates were sharply negative when the curve first inverted. It’s only been more recently that Fed policy moved toward restrictive levels. In prior cycles, real Fed Funds proved restrictive at the 3.5% (or higher) level. To the extent that inflation continues declining, which we think it will, and the Fed keeps rates unchanged, Fed policy will become proportionately tighter, and could start to choke the economy. This is one reason that could support the Fed’s decision to start cutting rates in the second half of the year.
As the economy and corporate earnings have continued to grow, it is apparent that policy has not been too restrictive, or at a minimum, rate increases are taking longer than expected to have an impact. Today, (real) economic growth remains stronger than expected in the 2% to 3% range, a level that is above the Fed’s long-run growth estimate for the U.S. This robust activity seems to have been driven by strong consumer spending despite an erosion of pandemic savings.
Looking ahead, our base case is for the economy to continue expanding but we suspect the pace of growth will slow over the remainder of the year. We also expect inflation and labor markets will slow but not seize in the near-term, and we think this backdrop could remain supportive for risk assets.
Inflation
Last year, it seemed as though the Fed was decisively winning the inflation battle. But in the first quarter of 2024, particularly in January, inflation came in higher than expected. These higher readings seem to set the bar higher in terms of evidence the Fed will need to see before cutting rates. As a result, the market dramatically repriced 2024 rate-cut expectations, going from an estimated 6-7 cuts at the start of the year to 1-2 cuts as of June.
More recently, the April inflation reading showed moderate signs that inflation might again start to trend lower. Our belief has been that despite some higher readings earlier this year, the Fed’s aggressive rate hikes have tamed inflation, and we expect to see continuing disinflation. The Fed targets price rises by the change in the personal consumption expenditures (PCE) deflator, which tracks the prices of a mix of goods and services. By this measure, inflation peaked at over 7% in 2022 and has continued to decline. On the last trading day of June, the latest PCE release came out at 2.6%, down from the 2.7% in May. On a month-over-month basis, PCE was flat. The Core PCE, which excludes food and energy was up 2.6%, and on a monthly basis, Core PCE is up 0.1%, lower than 0.3% in May. During the last Fed meeting, the Fed projected a 2.8% Core PCE for the end of the year, and with that number in mind, they were planning one rate cut in the remainder of 2024. If the data remains at or below their recent year-end estimate, the Fed could cut sooner and more than expected. For now, the market is expecting two rate cuts, with the first in September and the second in December. A second popular inflation indicator, the Consumer Price Index (CPI), has followed a similar pattern as PCE, peaking at 9% in 2022 and falling to its current level of 3.25%.
We should highlight that on a year-over-year basis, U.S. core CPI is running higher than U.S. core PCE and in fact, most foreign-developed market core inflation measures. Only the U.K. CPI is higher than the U.S. CPI, at over 4%. A primary reason behind the higher U.S. CPI number, whether compared to PCE or other foreign developed markets, is the much higher weight it assigns to owners’ equivalent rent (OER). OER is an estimate of the cost of homeownership, or the rent a homeowner would pay for a similar property nearby. While we have several questions about the OER approach and its accuracy, we believe the CPI number will continue to decline over the course of the year and into next year.
The chart on the right shows CPI and CPI ex-Shelter. If you exclude shelter from CPI, you can see that inflation has been tamed at or around 2% since May of 2023. We expect the shelter component to gradually decline over the remainder of the year, albeit not in a straight line, and thus CPI too.
Indeed, the Fed is in somewhat of a tight spot. It has and continues to repeat its commitment of 2% inflation as measured by the PCE deflator. Changing course now could cause the market to question the Fed’s commitment to that target, with the worry being that the Fed loses credibility.

We believe the Fed is inclined to cut rates this year, recognizing the risks of waiting too long. Our sense is that some Fed officials recognize higher rates are causing some economic strains in areas such as commercial real estate, regional banks, and lower-end consumers, and that some of today’s offsetting factors such as fiscal policy might not last forever. Furthermore, we suspect there is some risk to smaller-cap companies if rates remain elevated for much longer. Smaller-cap companies have a meaningful amount of expensive floating-rate debt that is tied to short-term rates, and that is nearing maturity. The Fed certainly doesn’t want to cause a recession when it’s unnecessary, and that’s the fine line they are walking today.
One prevailing question in the market is whether the U.S. presidential election will impact the timing of Fed policy changes. But let’s assume the Fed wants to delay cutting rates because they are concerned about the optics of appearing political ahead of an election; isn’t that in and of itself political?! Fed Chair Powell has stated that the looming U.S. presidential election will not influence the Federal Reserve’s interest-rate decisions, and that Fed policy decisions will be guided by the data and how those data affect the outlook and the balance of risks. Let’s hope that’s the case.
The Consumer
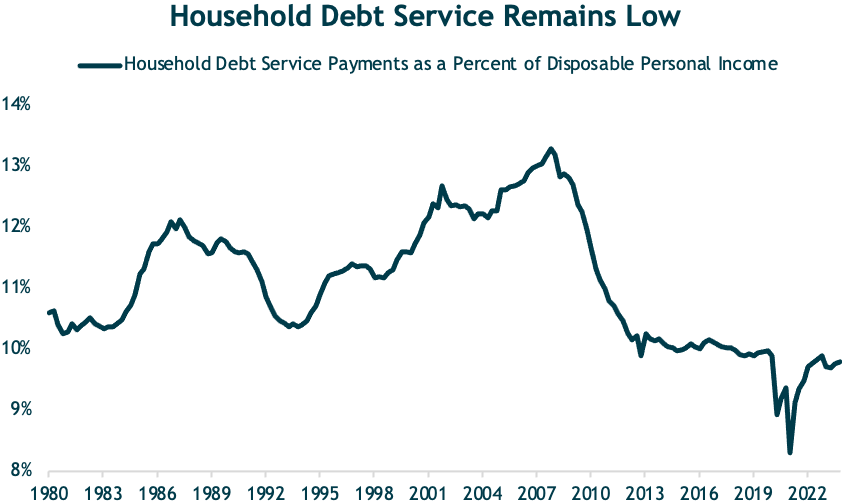
The consumer has driven U.S. economic growth for the past three years, thanks to improvements in both employment and real wages. The strong consumer has surprised many, given the headwinds of higher interest rates and inflation. However, it’s worth pointing out that U.S. consumers are not highly levered like they were prior to the Financial Crisis (see debt service chart below). The consumer debt service ratio (household debt service payments as a percentage of personal income) remains sub 10%. Moreover, while interest rates and mortgage rates have increased significantly, their impact on the economy has been softened by the fact that the share of homes without a mortgage has risen to roughly 40%, and that nearly half of all mortgages outstanding have fixed rates below 4%.
That said, there are signs the U.S. consumer may be slowing. In our view, consumption growth is slowing as high borrowing costs and high prices are starting to bite. Certainly, inflation has slowed since the peak in 2022, but prices have increased more than 20% cumulatively since 2020 based on CPI, and consumers are not excited that prices are rising at a slower pace.
So far, any concerns around the consumer have not seemed to scare investors. Investors have pushed the S&P 500 to more than 30 new highs this year as the economy has grown at nearly 3% (in real terms) over the past four quarters. However, as excess savings shrink, the impact of inflation is more painful. We would characterize this process as a normalization after a period of splurging, rather than something more ominous in the near term. Therefore, we are currently viewing this as a yellow light and not a red one. Looking ahead, we will be monitoring the labor market and the consumer for signs of further deterioration, which could impact our positioning.
Equity Markets
At the end of June, our portfolios’ equity exposures remain overweight in the U.S. and underweight in emerging markets. After falling 4% in April, global stocks rebounded in May and June, with the MSCI ACWI Index gaining nearly 3% for the quarter. U.S. stocks again led the charge, with all three major indexes – the Dow Jones, Nasdaq, and S&P 500 all making new all-time highs in the quarter.
Continuing the theme from 2023, an even smaller handful of U.S. mega-cap technology stocks continue to lead way higher for the domestic equity market (S&P 500 Index). Last year, just 30% of stocks within the S&P 500 outperformed the index. This was a historically low figure— a level not seen since the late-1990s. Yet, so far in 2024, the concentration of returns moved even higher. Through late June 2024, only 27% of stocks are outperforming the S&P 500. This is the lowest reading on record going back more than 50 years. As shown in the table below, the top 10 contributors in 2024 have accounted for 70% of the S&P 500’s 15% year-to-date return.
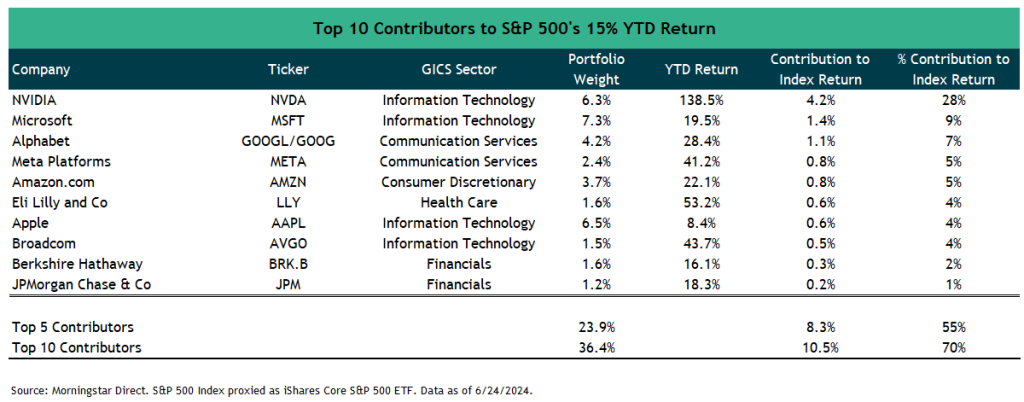
While the concentration levels at the index level are noteworthy, it’s possible that this trend can continue for some time. Afterall, the strong run for Artificial Intelligence (AI) stocks has been supported by companies such as Nvidia which continue to deliver and beat earnings estimates.
Our portfolios have meaningful exposure to many of these strong-performing mega-cap stocks, which has benefitted portfolio performance. But we remain balanced, also owning larger-cap value and smaller-cap U.S. stocks that are trading at more attractive valuations and offer important diversification benefits. Smaller-cap U.S. stocks, for example, are trading at valuations relative to large-cap stocks that have not been seen in years, dating back to the late 1990s. We should also note that we think it’s quite possible that areas of the equity market which have lagged and have lower valuations—small-cap companies and value stocks—could benefit from an ongoing expansion and a broadening out of the market rally.
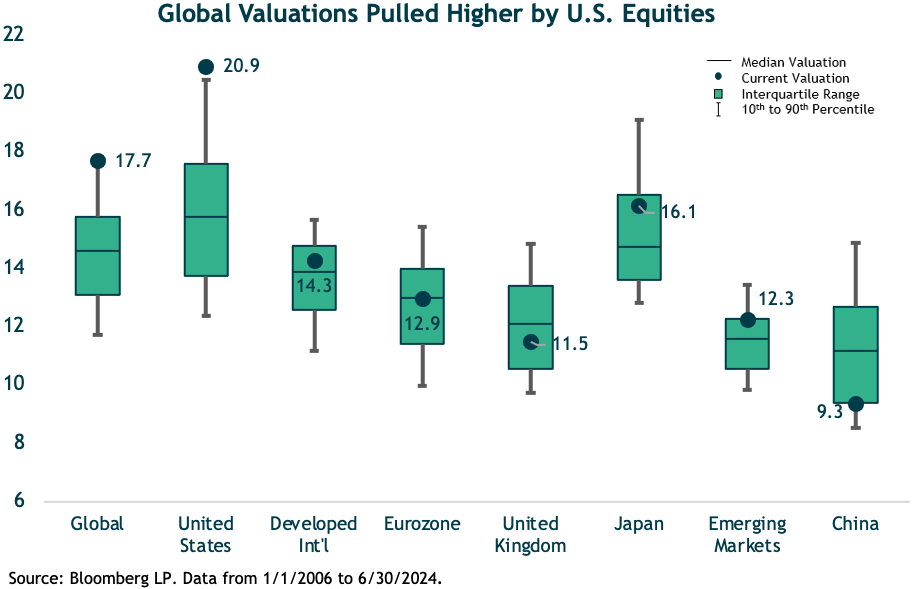
From a valuation perspective, the discount for developed international stocks versus the U.S. is the widest it’s been in decades. From 2006 through 2016, the U.S. and developed markets traded within one multiple point of each other. The average forward P/E for the S&P 500 over the period was 14x compared to 13x for MSCI EAFE. Since 2016, the valuation gap has widened substantially. The S&P 500 now trades at nearly 21x forward earnings, while the MSCI EAFE remains close to 14x. The story can be seen in the chart below. U.S. stocks trade near peak valuations, while other regions offer better relative values as their valuations are not as extended. All else equal, lower starting valuations imply better long-term returns and should provide more of a valuation cushion in the event that multiples contract in a stock market sell-off.
While relative valuation gaps between different geographic stock markets may be a reason to overweight one versus another—we believe one should also factor in absolute valuation levels for tactical positions. Given that neither developed international nor emerging-market stocks are cheap on an absolute basis, we do not think a tactical position in these regions is warranted.
On the global stage, there are a significant number of elections in 2024, and a rise in political uncertainty has and will likely bring volatility to the markets. For example, in mid-June, we saw volatility jump in France, a response to the decision by French President Macron to call a snap election after his party had disappointing results in the European Parliamentary elections. The markets were taken by surprise by the announcement of an early election, and the reaction focused on the Eurozone markets and more particularly, French securities. French government bonds tumbled, driving yield spreads over safer German bonds to the highest level in seven years. European stocks also declined though the drop was more pronounced in France, with Eurozone bank stocks getting hit the hardest, particularly French banks.
Of course, here in the U.S., we expect pockets of volatility as the drumbeat of the November election gets lounder, particularly given today’s polarized political environment. Undoubtedly, headlines will influence short-term market fluctuations but longer-term, fundamentals are what drive market performance. Our focus will continue to be on factors such as Fed policy, economic growth, inflation, fiscal imbalances, valuations, etc. Our intention is not to minimize the gravity of the election, but to point out that the gears of the economy are not overhauled based on an election outcome. For example, the U.S. economy is consumer-driven and that’s not going to change. Ultimately, the fundamentals of the economy don’t change overnight, and we don’t think an investment strategy should either. Our approach will be to stay the course and be on the lookout for opportunities that arise with market fluctuations.
Fixed-Income /Bond Markets
Bonds came into 2024 on a high note after ending 2023 with strong performance, and it seemed that the days of losses were behind us. After all, the economy was growing, inflation had declined meaningfully and consistently since mid-2022, the Fed was discussing rate cuts, and unemployment remained low. However, inflation and job growth came in higher than expected, causing a dramatic reduction in the number of expected rate cuts. This created an unusual level of interest-rate volatility, and questions mounted around Fed policy, pushing yields higher. This resulted in more attractive income for most fixed-income sectors, and this higher income will serve as a buffer against a move higher in rates.
As mentioned above, the Fed’s latest forecast is for one cut over the remainder of 2024, and then four cuts over the next two calendar years. The current market consensus is for one to two cuts this year. Our view is that longer-term interest rates (the 10-year Treasury) will be rangebound between 4.0% and 4.75% in 2024, and we would not be surprised to continue seeing sharp movements in yields within this range as the market continues to react to economic data and try to anticipate the Fed’s next move. Regarding short-term rates, we think the Fed will cut up to two times this year and potentially four times in 2025.

In the meantime, the yield curve (shown below) remains inverted, meaning short-term bonds yield more than longer-term bonds. Ultimately, we will have to return to a normal shaped yield curve, where investors receive higher yields for longer maturities. As we show in the chart below, investors are receiving slightly more than 1% additional yield for investing in short-term bonds compared to the 10-year Treasury, with less interest-rate sensitivity.
Given our view that inflation is under control for now, and that short-term interest rates have peaked and will likely move lower explains our fixed-income portfolio positioning. We maintain meaningful exposure to short-term bonds, taking advantage of the inverted yield curve, emphasizing shorter-term higher-yielding securities, while also maintaining some exposure to longer-term bonds, which can also provide protection in the event of a stock-market downturn.
Our rationale for our short-term exposure is as follows. If rates are unchanged, we benefit from holding short-term bonds with their elevated yields, while still earning an attractive yield on the longer-term core bonds. If long-term yields move higher (prices move lower as yields increase), short-term bonds will hold their value and outperform long-term bonds and with less volatility. Where short-term bonds could lag meaningfully is if longer-term yields move materially lower (prices higher). This would occur during a flight to safety, likely due to recessionary concerns.
Regarding corporate bonds, defaults remain below average. According to JP Morgan, high-yield bond and loan default rates are 1.8% and 3.1%, respectively, which are 1.09% and 0.17% below levels at the start of the year. While we expect to see defaults move moderately higher over the remainder of the year, we do not foresee a near-term risk of a spike in default rates given still attractive corporate fundamentals.
Looking ahead, we will be on the lookout for opportunities. A specific opportunity we are monitoring is longer-term interest rates. If we see a meaningful increase in these yields, it is likely that we would increase exposure to high-quality, interest-rate sensitive securities to capture attractive yields and provide more ballast to the portfolios. Conversely, if we benefit from a meaningful decline in longer-term bond yields, it’s possible we could further increase our exposure to short-term bonds.
Conclusion
The U.S. economy looks set to benefit from a continuing gradual moderation in growth, inflation, and jobs, creating a backdrop that could support risk assets. As was the case last quarter, the stock market continues to hit new highs as economic growth continues to benefit corporate earnings. U.S. concentration remains high, with the Magnificent Seven representing over 25% of the S&P 500. There’s no doubt that the other 493 stocks of the S&P 500 have struggled on a relative basis, but they could be set to move higher if the key economic drivers outlined above continue to fuel the economy. That said, fears of a recession haven’t completely abated. Looking out to the end of the year and into next year, the question remains whether a recession will be avoided or delayed. As such, we are keeping a close eye on the typical drivers of recession, including the labor market, consumer spending, and corporate earnings, where a deterioration in these variables could influence portfolio positioning.
Heading into the second half of the year, we continue to anticipate pockets of volatility given headline risks related to Fed policy, geopolitical events, and the upcoming U.S. presidential election. In the event of volatility, we will look to be opportunistic, taking advantage of any attractive risk/reward opportunities that arise.
We thank you for your continued confidence and trust.
Certain material in this work is proprietary to and copyrighted by Litman Gregory Analytics and is used by Argent Financial Group with permission. Reproduction or distribution of this material is prohibited, and all rights are reserved.

