


BY: Tom Stringfellow, CFA®, CPA®, CFP®
Chief Investment Strategist
The Fed Squint
- The first rate cut in nine months came in September. Was it a near-blink in response to weak jobs data, or a nod to Washington’s political pressure?
- After downward revisions, unemployment is up to 4.3% and “true” private payrolls—excluding government, healthcare, and education—are growing just 0.4% year-over-year.
- Market leadership has broadened beyond the “Mag 7,” with industrials, financials, homebuilders, and even utilities finding support from structural AI-driven demand.
- Investor enthusiasm itself has become a driver. Nearly $7.3 trillion remains in money market funds, and falling yields could push some of that cash back into equities.
Cutting Rates with One Eye on Jobs
To no one’s surprise, the Federal Reserve delivered a quarter-point rate cut in mid-September. The move had been telegraphed for weeks, if not months, and the market’s immediate response was more muted than jubilant. But while the headlines focused on the mechanics of the 25-basis-point trim, the more important question is what comes next—and why the Fed chose this moment to pivot again toward easing.
The last cut before this one came back in December 2024, when the Fed offered a similar 25-basis-point reduction. What has changed in the intervening nine months is the composition of growth and the balance of risks. Inflation, while still elevated, has shifted in character. The August Consumer Price Index showed a year-over-year gain of 2.9%, with core inflation at 3.1%. Dig deeper, and the Atlanta Fed’s decomposition tells the story: “sticky” categories, such as rents and medical services, remain stuck at 3.4%—unchanged since July—while “flexible” components, like energy and apparel, rose slightly to 1.6% after more than a year of flat readings. In other words, the recent heat in CPI is cyclical and one-off rather than structural.
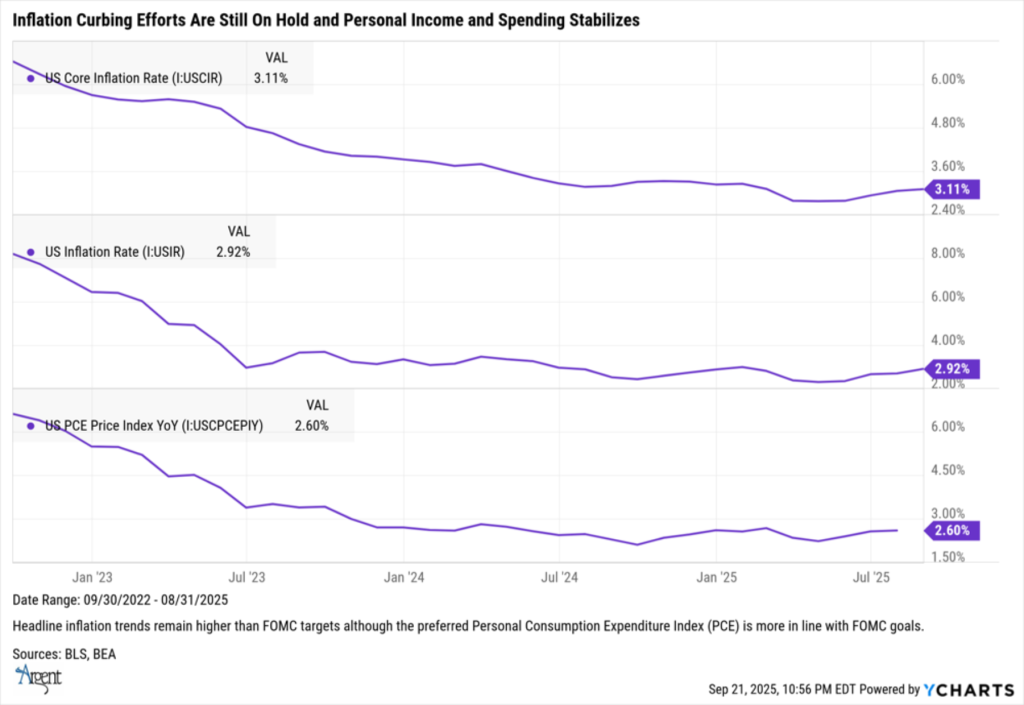
Meanwhile, the labor market has softened more materially. The Bureau of Labor Statistics revised cumulative payrolls lower by nearly one million jobs, a reminder that even the headline data can overstate momentum. June, after revisions, registered a net job loss. Unemployment has ticked up to 4.3%, and “true” private payrolls—excluding government, healthcare, and education—are up only 0.4% year-over-year. The household survey is somewhat more encouraging at 1.2% growth, but that remains below historical norms. Permanent job losers, a category that has reliably foreshadowed recessions, rose above their 36-month moving average this summer. The combination explains why Powell’s Jackson Hole remarks put greater emphasis on “downside risks to employment” than on sticky inflation.
Against this backdrop, the Fed’s September statement contained two dovish signals. First, the explicit acknowledgment that labor market risks are rising. Second, the subtle but telling removal of the words “extent and timing” from its forward guidance. The change signals that this cut is not a one-off but part of a likely series. Indeed, the Fed’s own “dot plot” now suggests two more cuts before year-end, though the committee remains divided.
Markets have treated the cut as largely priced in, with the S&P 500 settling around 6,664 at week’s end, up nearly 13% for the year but showing little reaction on the day. The muted response should not be mistaken for irrelevance. History shows that equities—particularly small-and mid-cap stocks—tend to outperform in the months following the start of a cutting cycle. Already, the Russell 2000 and S&P 600, which are more sensitive to financing costs, have perked up. Breadth has broadened, and sectors tethered to rate relief, such as financials and homebuilders, are leading. Over shorter timeframes, small caps have pulled ahead, with the Russell 2000 gaining about 16% versus ~12–13% for the S&P 500.
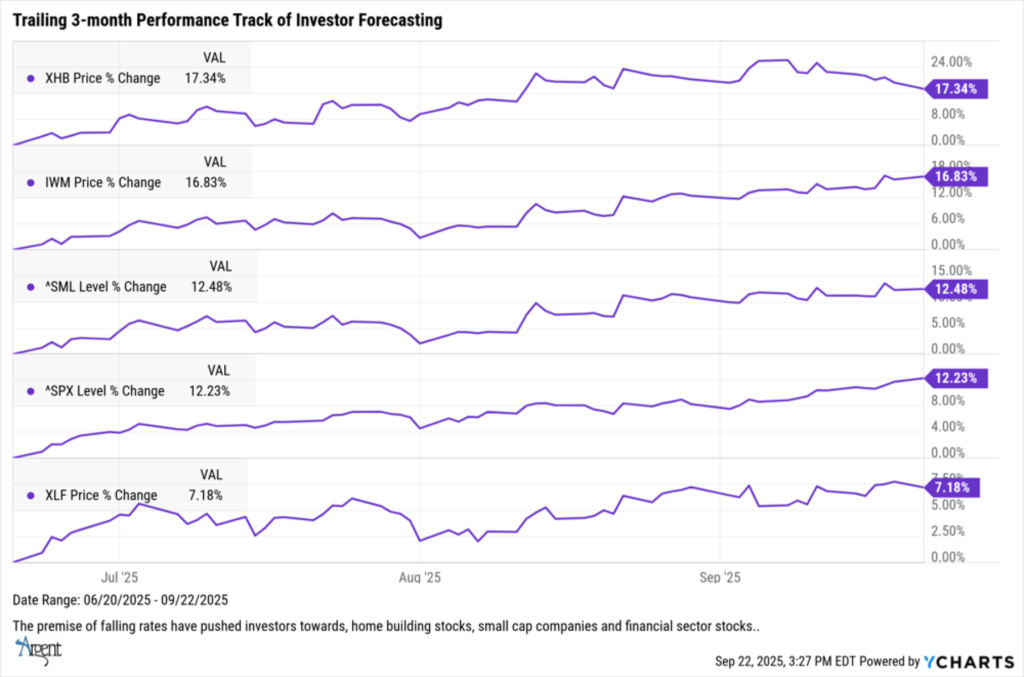
None of these suggest we are out of the woods, however. What the Fed has engineered is less a soft landing than a recalibration: a recognition that tariffs have added temporary inflation pressure while job creation has slowed. If two more cuts materialize this fall, the path of least resistance for equities is still higher. But the real message of this Fed pivot is that the balance of risks has shifted. Investors will need to look past the headline rate moves and assess whether earnings power, consumer health, and productivity gains can sustain the expansion as monetary support quietly returns.
A Patchwork Economy – Inflation Sticky, Jobs Softening, Consumers Steady
The September cut was delivered into a mixed and often contradictory economic backdrop. Inflation data, while still elevated, has shown a pattern of divergence between categories. CPI excluding shelter, one of the more policy-sensitive measures, stood at 2.5% year-over-year. All told, inflation is above the Fed’s comfort zone but well within historical ranges and no longer accelerating across the board.
Producer prices have followed a similar course. While energy costs remain volatile, broader measures of input costs have not reignited. PPI growth has stayed in line with expectations, while the Personal Consumption Expenditures index—often the Fed’s preferred gauge—continues to hover modestly above target but without signs of re-acceleration. The key story is that inflation pressure is uneven: isolated in some categories but cooling in others.
The labor market, once a pillar of strength, has clearly lost momentum. The most notable development this summer was the nearly one-million-job downward revision to prior payroll estimates, coupled with a rare net job loss in June after adjustments. As already noted, the unemployment rate has edged up to 4.3%, and average job creation in 2025 has slowed to just 9,000 per month.
Consumers remain resilient. In August, retail and food services sales rose 0.6% month-over-month, and the “control group” (excluding autos, gas, and building materials) increased 0.7%, both ahead of expectations and supported by strong nonstore/e-commerce and back-to-school categories; headline sales are running nearly 5% above a year ago. At the same time, sentiment has softened: the University of Michigan’s preliminary September index fell to 55.4 from 58.2 in August, while the Conference Board’s confidence gauge dipped to 97.4 in August from 98.7 in July.
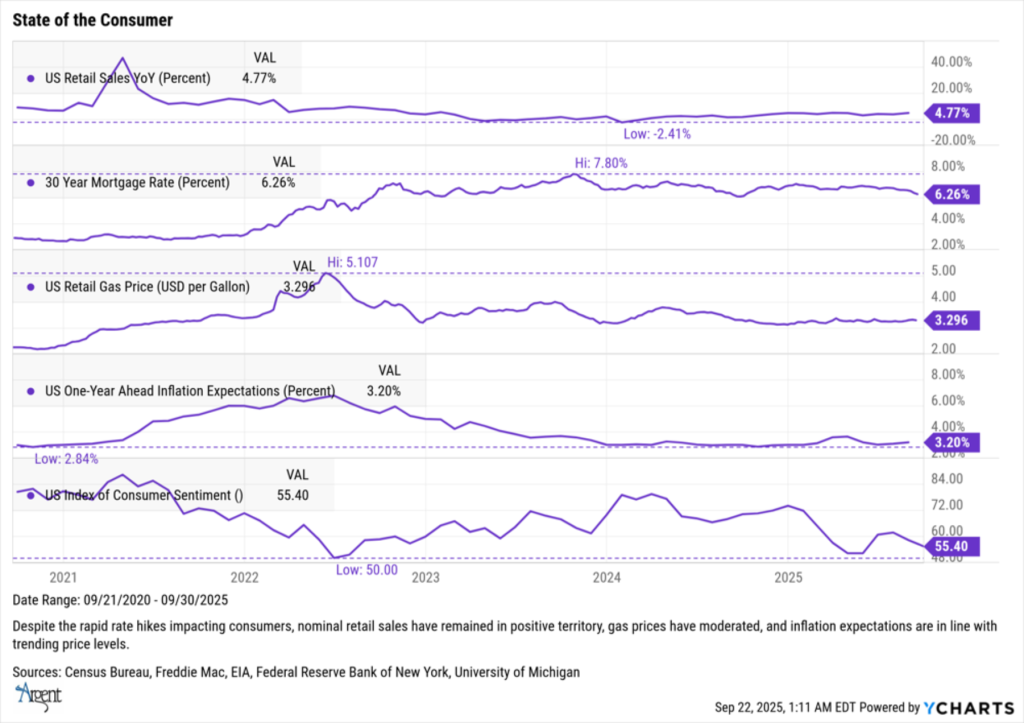
Housing has become more mixed. The sharp, rate-driven pop is real—MBA’s weekly survey for the week ended Sept. 12 showed total mortgage applications up 29.7% week-over-week, with refinancing up about 58% and purchase apps up 3%, as the average 30-year fixed rate fell to 6.39% and the 10-year Treasury hovered a little above 4%. But hard activity data is lagging the rate move: August housing starts ran at a 1.307 million SAAR (-8.5% m/m) and permits at 1.312 million (-3.7% m/m), including a 2.2% monthly decline in single-family permits—suggesting the applications surge may take time to translate into groundbreakings.
Balance-sheet and credit metrics round out the picture. Total household debt rose to $18.39 trillion in Q2 2025; credit-card balances reached $1.21 trillion; and 4.4% of outstanding household debt was in some stage of delinquency, with student loans seeing a notable pickup to 10.2% at 90-plus-days delinquent following the resumption of reporting. July’s Federal Reserve’s monthly Consumer Credit report (known as G.19) shows consumer credit still expanding at a moderate pace, with revolving credit up at a 9.7% annualized rate and nonrevolving up 1.8%. These indicate pockets of stress but not a system-wide deterioration, consistent with a consumer that is cautious yet still spending.
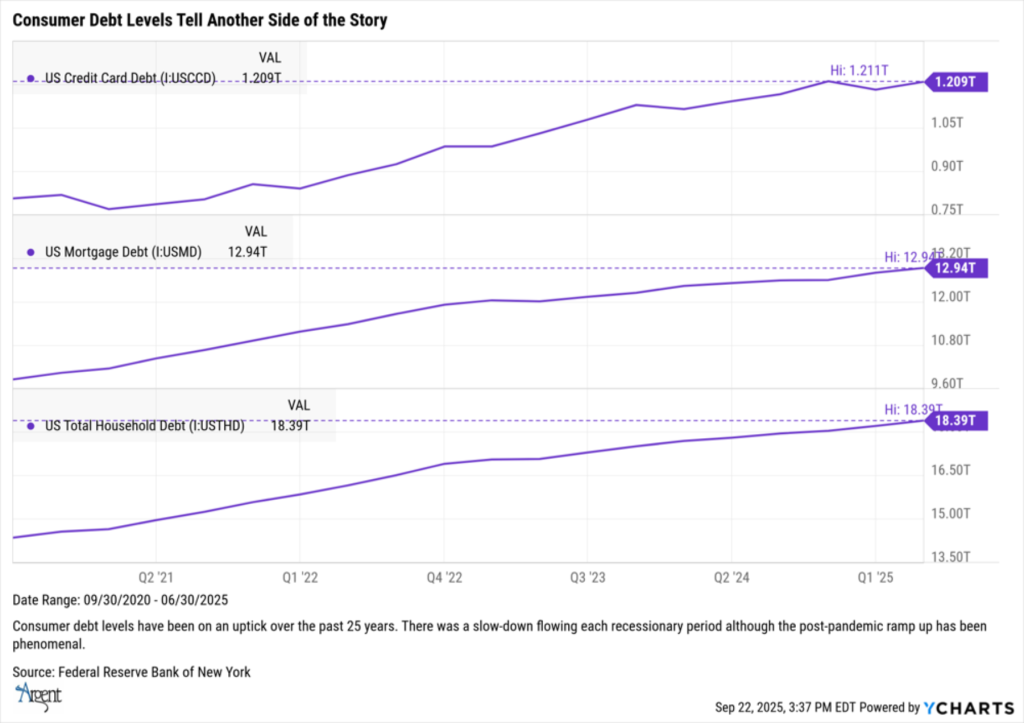
The takeaway from this economic recap is one of divergence. Inflation is running modestly hot but uneven. Jobs are cooling, with clear signs of structural adjustment, yet consumers continue to spend. The housing downturn may be finding a floor as lower rates begin to unlock demand, though construction data have yet to fully confirm the rebound. It is this uneven economic canvas—neither recessionary nor robust—that sets the stage for the Fed’s recalibration and frames the market’s cautious optimism.
Beyond the Mag 7 – Breadth Returns
Equity markets have entered the fall on firmer footing, but with plenty of crosscurrents just beneath the surface. The S&P 500 climbed nearly 13% year-to-date, as already noted, and yet this performance masks a story of rotations, relief rallies, and lingering caution that deserves closer examination.
Small caps, long the laggards of this cycle, have begun to stir. The Russell 2000 is positive year-to-date as rate-cut expectations and falling yields sparked sharp bursts of outperformance, including gains of more than 2% on Fed headlines. The S&P 600, which excludes unprofitable firms, has lagged the broader small-cap benchmark but shows both a clearer uptrend and uptick in investor interest. These moves are consistent with historical patterns, as small-and mid-cap stocks typically respond first to easier monetary policy. Their balance sheets are more exposed to borrowing costs, and their earnings are more levered to domestic demand.
The Artificial Intelligence (AI) complex continues to set the tempo at the index level. Over the past month, several high‑profile capacity and cloud agreements underscored that the spend cycle remains intact: a multi‑year, multi‑billion-dollar cloud deal under discussion between Oracle and Meta; Nvidia’s backstop agreement to absorb unused CoreWeave capacity; and a string of new data‑center power and build commitments from utilities and hyperscalers. Data‑center construction outlays in the U.S. have risen to record levels this year, and utilities are lifting demand outlooks as AI loads come into the grid. The practical takeaway for equities is twofold: first, the megacaps tied to AI infrastructure remain fundamental drivers; second, downstream beneficiaries in power equipment, grid, and select industrials are seeing improving order books.
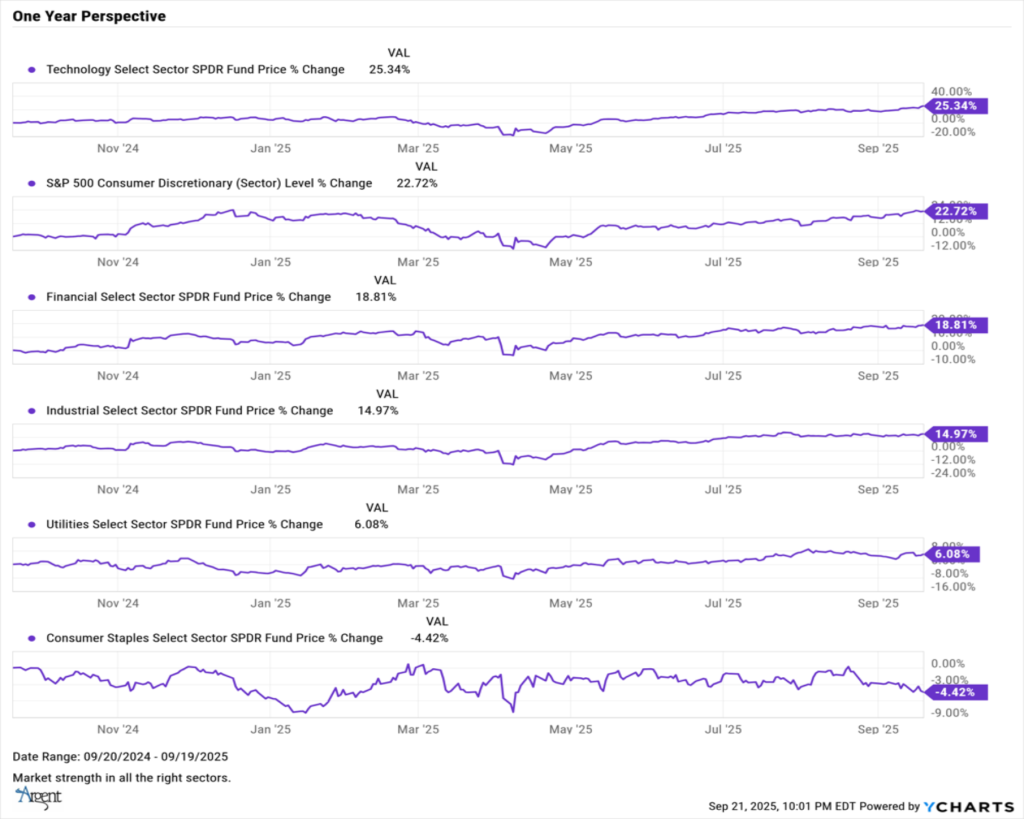
Breadth has improved from the narrow “Mag 7” dominance that defined much of 2023 and early 2024. Industrials, financials, and homebuilders have led in recent weeks, while utilities have staged a surprising rebound as investors recognize structural electricity demand tied to AI buildouts. Banks and capital‑markets names have benefited from the prospect of lower short rates, while select semicap equipment makers continue to ride the investment wave into memory, packaging, and advanced nodes.
Sector performance underscores these crosscurrents. Technology remains the anchor of the index, but its extreme concentration risk is evident. Energy has softened as crude prices sit below year‑ago levels. Health care continues to lag, weighed down by managed‑care volatility and policy risk, even as obesity/diabetes therapies buck the trend. Consumer staples have disappointed, reflecting both margin pressure and reduced pricing power.
Still, not all measures confirm strength. According to Dow Theory, transports remain in negative territory for the foreseeable future, even as industrials set new highs. This divergence has kept the last official Dow Theory signal bearish since March 2025. While the broader market makes new highs, the lack of confirmation from transports is a caution flag that suggests the rally’s foundation may not be as solid as headline levels imply. The reasoning from the Sevens Report is that when both the Dow Industrials and Transport stocks begin falling into a technical downtrend, the economy is heading into (or already in) recession.
International markets add another layer. Japan’s advance remains supported by corporate reforms, governance pressure, and a weaker yen that aids exporters. In Europe, valuations and a softer dollar have provided a tailwind alongside incremental clarity on tariffs; cyclicals have led when rate‑cut odds rise, although dispersion remains wide. Emerging Asia continues to benefit from the global AI supply chain, while country‑specific politics and growth differentials drive week‑to‑week swings. The common thread outside the U.S. has been better relative value meeting improving macro visibility, which argues for persistence rather than a one-off-spike-, provided global growth avoids a stall.

A word on concentration: It is easy to fixate on the weight of the top ten U.S. names, but globally the U.S. is not uniquely extreme. Many single‑country markets abroad are even more top‑heavy. Equal‑weight and ex‑mega‑cap lenses show that when breadth improves—as we have seen in August and September—relative performance can shift quickly toward smaller constituents without requiring a top‑down collapse of the leaders. For portfolio construction, the message is to embrace the breadth where it is emerging—small caps, international cyclicals, utilities tied to grid buildout—while acknowledging that the large‑cap AI platforms still sit atop a durable capex cycle.
The bigger picture is that leadership is broadening. Rate‑sensitive cyclicals are picking up momentum, international equities are competing for attention, and utilities are quietly benefiting from long‑term structural shifts. At the same time, transports and defensive sectors caution against overconfidence. This is not a one‑way rally, but it is a healthier market than the narrow leadership of a year ago. For investors, the task is to lean into the new leaders while staying cautious about the cracks that remain.
Commodities, Currencies, and Capex
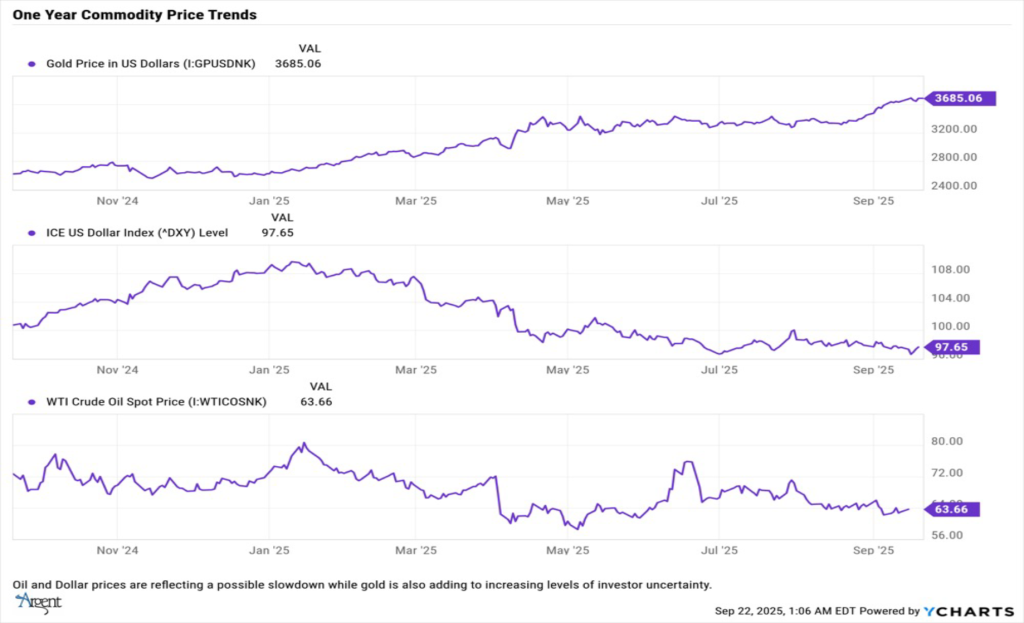
Cross-asset moves since late August have reflected the same push-pull we see in the economy: enough growth to keep risk assets engaged, enough caution to keep hedges relevant. Crude oil has churned in the low- to mid-$60s, with inventories and refinery run rates delivering mixed messages and year-over-year price comps still a headwind for Energy sector earnings. Gold, after setting fresh records, has paused but remains in a primary uptrend consistent with persistent fiscal deficits, reserve diversification by central banks, and episodic dollar softness. Copper’s uptrend from July remains intact but choppy, mirroring shifting perceptions about global manufacturing.
In currencies and rates, the U.S. dollar rebounded modestly after the Fed decision, a classic “sell-the-news” reversal following a multi-week slide into the meeting. The broader path still points to a gentler dollar if the rate-cut cycle proceeds and growth stays steady, which would tend to support non-U.S. equities and commodities at the margin. The 10-year Treasury yield has hovered near 4%. Stability around that level remains the best-case backdrop for equities because it implies neither inflation nor a growth scare. A decisive break lower would likely signal growth concerns rather than renewed disinflation momentum.
One structural theme deserves emphasis: power demand. Utilities have raised load forecasts as AI data-center projects move from investor decks to signed power commitments and groundbreakings. Multi-hundred-megawatt contracts, with options to scale toward gigawatt campuses across several states, are reshaping regional transmission plans and capex priorities. That shift links technology spending directly to old-economy infrastructure—substations, transformers, high-voltage equipment—and helps explain why parts of Industrials and Utilities have rerated even as classic defensives remain out of favor. These cross-asset moves also frame the backdrop for equity investors now weighing valuation risk against momentum.
Momentum vs. Valuation – What Matters Now
The September pivot leaves investors balancing two realities. On one hand, valuations are stretched. The forward P/E of the S&P 500 now sits at 22.6, well above five- and ten-year averages, and household allocations to equities are at record highs. On the other hand, market momentum remains strong. Breadth has improved, earnings revisions are positive, and both retail and institutional flows continue to favor equities despite visible risks. Thus far, corporate earnings estimates for Q3 are expecting a growth rate of 7.7% according to FactSet Earnings Insight, representing the ninth consecutive year-over-year earnings growth rate for the S&P 500 constituent companies.
Investor enthusiasm itself has become a driver. Money market assets remain near $7.3 trillion, as expectations of lower yields suggest a portion could rotate into equities. Corporate and government spending are adding to the flow story, with AI-related capex, infrastructure investment, and fiscal initiatives all injecting liquidity into selected industries. Customer demand remains resilient in retail spending, travel, and hopefully soon back into housing.
From here, the market’s path depends on the interplay of valuation discipline and momentum. Elevated multiples can persist so long as earnings growth, flows, and policy support remain intact. What matters most is where the money goes—both from investors reallocating cash and from corporations and governments directing spending toward technology, housing, and energy transition themes.
Balancing Caution and Enthusiasm
September’s market narrative has been defined by a Fed that finally shifted from holding the line to cutting rates, and by an economy that is slowing in places but not collapsing. Inflation is uneven, jobs are softening, and consumers are still spending. The housing outlook is still uncertain, but dropping mortgage rates would certainly provide additional market synergy, as would further upgrades in corporate earnings.
Markets have broadened beyond the Mag 7, with small caps, homebuilders, financials, and utilities all participating. International equities are showing persistence, particularly in Japan and parts of Europe. AI-related spending continues to be the central investment theme, pulling through to old-economy industries and reshaping utilities and industrials alike.
Valuations are elevated, but history shows they can remain elevated when momentum, earnings, and liquidity line up. Investor sentiment is skeptical, but positioning is heavy, with household equity allocations at record highs and money market cash waiting for redeployment.
The lesson for investors is twofold. First, respect valuations—they matter for long-run returns. Second, respect momentum and flows—they shape the path in the short run. The job ahead is to monitor where capital is actually moving, whether from households shifting cash, companies deploying capex, or governments funding infrastructure and energy transitions. Markets trade on money flows as much as on multiples, and September reminds us that both matter.
Not Investment Advice or an Offer -This information is intended to assist investors. The information does not constitute investment advice or an offer to invest or to provide management services. It is not our intention to state, indicate, or imply in any manner that current or past results are indicative of future results or expectations. As with all investments, there are associated risks and you could lose money investing.


