


BY: Tom Stringfellow, CFA®, CPA®, CFP®
Chief Investment Strategist
Artificially Intelligent
- While investors obsess over the Federal Reserve’s next interest rate moves, equity market resilience owes much to structural shifts toward AI-driven investment.
- ISM surveys confirm that factory output has contracted for five consecutive months, and order books are thinning in industries tied to global trade.
- Retailers are no longer experimenting at the edges—they’re deploying AI at scale to personalize discovery, optimize inventory, and compress delivery times.
- The economy can wobble, surveys can soften, and the labor market can lose a step; yet the corporate decision to wire AI into the operating core is already committed.
Earlier this month I attended the AI4 Conference (Fourth Artificial Intelligence Conference) in Las Vegas. I’ve been to countless industry gatherings over the years—energy conferences, investment summits, technology expositions—but what struck me upon arriving at AI4 was the sheer scale of the event. More than 7,500 attendees, representing not just the obvious players from Silicon Valley and Wall Street, but also traditional industries you wouldn’t normally expect to see leaning into artificial intelligence: logistics companies, healthcare networks, energy providers, insurers, regional manufacturers, and even educators.
It is becoming clear that AI is no longer a niche conversation but rather the narrative driving strategic planning across both corporate and main street businesses. Discussions ranged from practical automation use cases—AI triage in hospitals, dynamic routing in freight, predictive analytics in utilities—to the macro investment questions: who is financing the build-out of data centers, which semiconductors will dominate the next generation of chips, and how fast AI-related capital expenditures will flow into the broader economy.
The tone of conference panel discussions was revealing too. Conversations were practical, often technical, and centered on solving real-world bottlenecks: latency in networks, cooling for hyperscale data centers, rising energy intensity, and the scarcity of trained engineers. If Y2K marked an era when companies poured billions into software infrastructure out of fear of being left behind, AI4 suggested that corporations are now spending at scale not out of fear, but out of competitive necessity.
That distinction matters. Unlike many speculative bubbles of the past, AI already has tangible revenue and productivity impacts. Microsoft, Google, Amazon, and Meta have disclosed tens of billions in incremental AI-related capital spending for 2025 alone, and these are not distant promises—they are dollars hitting the ground today in servers, chips, and training platforms.
Goldman Sachs recently estimated that AI-related capex could add half a percentage point to U.S. GDP growth this year, effectively offsetting weakness elsewhere in the economy. It’s not just the largest technology companies: from insurance underwriters to mid-sized manufacturers, corporate leaders at AI4 spoke openly about integrating machine learning and generative models into their operations.
It was also evident that capital markets are paying attention. In one breakout session, a mix of institutional allocators and private equity managers pressed panelists about timelines for return on investment (ROI), the sustainability of hyperscale data center demand, and whether cloud pricing models can hold as AI workloads increase. These are not the kinds of questions that speculative traders ask.
This backdrop provides an important lens through which to view the broader market environment in August. While investors have rightly obsessed over the Federal Reserve’s next move on interest rates, the resilience of equity markets this summer owes much to the structural shift toward AI-driven investment. Yes, the labor market has softened, and yes, manufacturing indicators point to contraction. But AI-related spending is, for the moment, cushioning what would otherwise be a far gloomier outlook. The story of 2025 will most likely be: “AI spending kept the expansion alive.”
Labor Market—Cracks Beneath the Surface
While artificial intelligence and technology spending may be dominating headlines, the underlying story of the U.S. economy this summer has been about jobs—or, increasingly, the lack of them. The July employment report, released in early August, was sobering. Nonfarm payrolls rose by only 73,000, far below expectations, and revisions to prior months erased another quarter of a million jobs. The unemployment rate ticked up to 4.2%, the highest level in more than two years. For an economy that has prided itself on resilience in the face of aggressive interest rate hikes, this marks a clear inflection point.
It is not just the headline numbers that matter; the composition of job growth tells an even more nuanced story. Healthcare continues to add jobs, with 55,000 new positions in July, reflecting both demographic tailwinds and post-pandemic recalibration. Social assistance roles also expanded, albeit more modestly. But these gains were offset by weakness in goods-producing sectors, where manufacturing alone shed 11,000 jobs. This decline comes as ISM surveys confirm that factory output has contracted for five consecutive months, and order books are thinning in industries tied to global trade. Construction employment, once a pillar of strength thanks to public infrastructure spending and housing demand, has also slowed as higher mortgage rates sap activity.
These shifts echo into a broader structural concern: the economy is increasingly reliant on noncyclical service sectors to sustain employment, while the traditionally higher-paying, productivity-driven jobs in manufacturing and construction are now lagging. For households, this means wage gains are increasingly clustered in healthcare and government-supported fields, while private-sector wage pressures are softening. Small business surveys reveal that hiring intentions have fallen to their lowest levels since the early pandemic recovery. Job openings are shrinking, and voluntary quit rates—a useful proxy for worker confidence—have slipped back toward pre-COVID-19 norms.
For policymakers, this creates a genuine dilemma. On one hand, the Federal Reserve has long argued that inflation cannot be durably defeated without some slack in the labor market. On the other, the data now suggest the risk of over-tightening may already be materializing. If unemployment edges toward 4.5% or higher this fall, calls for aggressive rate cuts will only grow louder. The Fed’s challenge is to act swiftly enough to stabilize labor markets without reigniting inflationary risks.
The bottom line: beneath the surface of headline payroll numbers lies a story of divergence, fragility, and transition. The U.S. labor market has not collapsed—but it has lost momentum. The ability of the economy to sustain growth now depends heavily on whether AI-driven productivity gains can offset slowing job creation in traditional industries. It is this tension—between technological optimism and employment reality—that defines the backdrop for the rest of 2025.
ISM Weakness Meets an AI-Led Capex Supercycle
If you looked only at the purchasing managers’ surveys this summer, you’d think corporate America had its foot hovering over the brake. The ISM Manufacturing PMI printed 48.0 in July, the fifth straight month of contraction, with new orders and employment still struggling to find momentum. On the services side—the part of the economy that, for much of the past year, did the heavy lifting—the ISM Services PMI slowed to 50.1, barely on the expansionary side of the line. Even more telling, the Services Employment Index fell to 46.4, signaling outright contraction in hiring for a sector that typically buffers downturns. On the surface, that combination looks like a classic late-cycle stall: factories cooling, services tired, and businesses turning cautious.
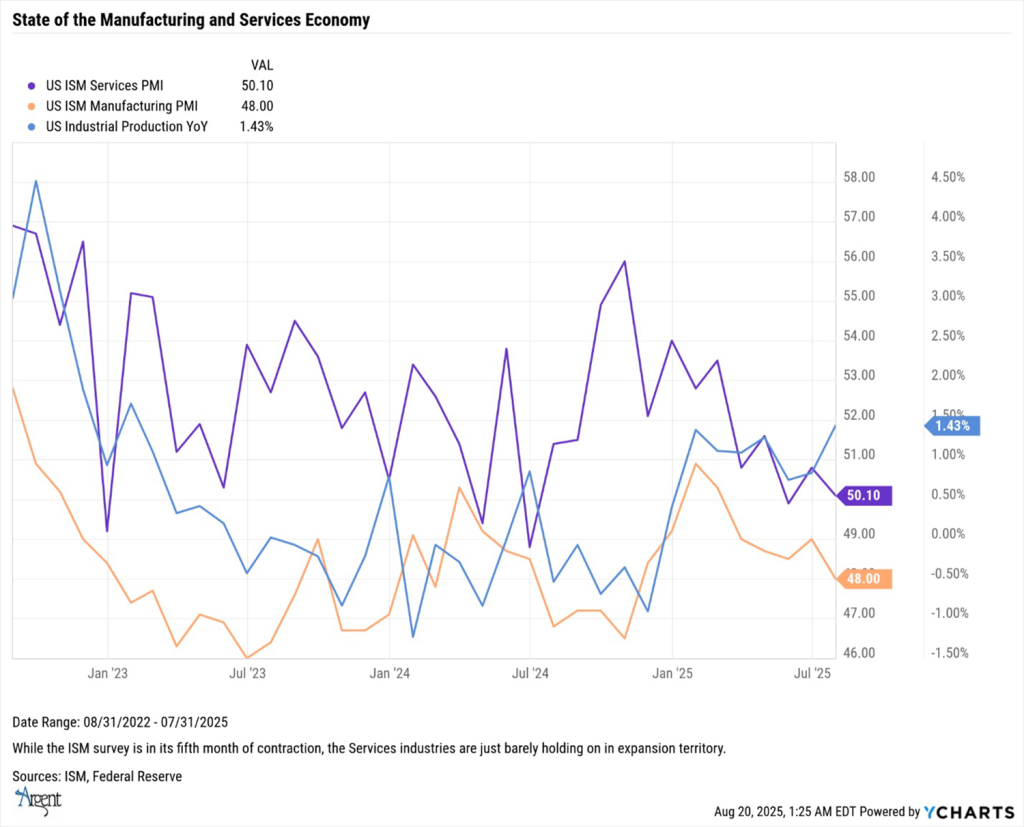
And yet, just beneath those survey headlines, a very different story is taking shape—one that doesn’t fit the usual script of broad-based belt-tightening. The country is in the early innings of an AI-driven capital spending wave that is both sector-concentrated and historically large. The contrast is jarring as diffusion-style PMIs are whispering “slowdown,” while corporate investment led by mega-cap technology is shouting “build faster.”
Meta, for example, now expects $66–$72 billion of capital expenditures in 2025, up roughly $30 billion year over year at the midpoint—primarily to fund data centers, servers, and AI accelerators. Alphabet has taken its own spending plans higher, with reporting around $85 billion this year after a spring reaffirmation of at least $75 billion; the company underscored that commitment with a $9 billion, two-year expansion in Oklahoma for AI and cloud infrastructure. Microsoft is scaling capacity at a pace that would have sounded fanciful a few years ago, management highlighted adding more than two gigawatts of new data center capacity over the past twelve months.
Amazon, for its part, is on track to exceed $118 billion of capex in 2025, with AWS (Amazon Web Services) the “primary driver.” Apple’s path is more nuanced—quarterly capex has begun to climb (about $3.46 billion in the June quarter), and management has telegraphed “substantial” increases, even as its headline $500 billion four-year U.S. investment plan spans far more than pure data center build. The directional takeaway is unmistakable: the biggest balance sheets in markets are committing staggering sums to AI compute, networking, and power.
Industry trackers estimate global data center capex surged approximately 51% to $455 billion in 2024 and accelerated again in early 2025, with 1Q25 up near 53% year over year. Hyperscalers accounted for more than half of that spend, and the bottlenecks were not interest rates or survey sentiment—they were power availability, land, and lead times for high-end chips and switchgear. Several hyperscale projects are slated to break ground globally in 2025, as vacancy rates in core markets continue to compress, constrained largely by grid access rather than lack of demand.
Where is the money going? AI servers and accelerators, high-bandwidth memory, advanced networking and fiber, liquid cooling and thermal systems, substation-grade power, and land for multi-gigawatt campuses. Microsoft’s commentary about “first gigawatt and multi-gigawatt data centers” captures the scale shift. The capex is not about marketing features—it’s about compute density, energy throughput, and latency. These are the choke points that determine whether AI workloads move profitably from proof of concept to production.
In 2025, a handful of mega-cap buyers are writing checks big enough to move national accounts data even if broad swaths of mid-market and small businesses are pulling back. That’s why you can see a services employment contraction and a manufacturing contraction at the same time that fixed-investment line items tied to power and communications structures grind higher: BEA’s measure for that category is running around an annualized $155–157 billion in 1H25—up from the ~$152 billion area in mid-2024—and still climbing as utility interconnects, switching, and grid upgrades are booked.
The spillovers are already visible across adjacent industries. Utilities are in their own multi-year capex cycle—S&P Global projects roughly $240 billion of 2025 spending for North American regulated utilities, growing at roughly a 10% annualized rate, with priorities in grid reliability, transmission buildouts, and interconnections for data center load. On the supply side for compute, semiconductor capex, which dipped in 2024 after a blistering 2021–22 run, is turning up again in 2025 as foundries and substrate makers retool for AI-specific demand. The result is a bridge between tech and “old economy”: wires, substations, transformers, concrete, and water rights are suddenly part of Silicon Valley’s shopping list.
Context helps. In the late-1990s telecom build-out, capex cascaded through the economy as carriers overbuilt fiber and switching capacity; the ISM surveys then captured broad enthusiasm because many firms were buying. Today’s pattern is narrower but deeper: fewer buyers with much bigger projects. The Financial Times recently tallied a potential $3 trillion global AI data center build by 2029, with single projects scoped in the tens of billions. That concentration explains why survey breadth can look tepid while national income accounts and company guidance point north. It also explains the risk: if a small set of buyers pause, the downdraft would be felt quickly through specialized supply chains.
What do we make of the juxtaposition? First, the weakness in ISM—especially the services employment subindex—should not be waved away. It tells us that, for the median firm, demand is softer, pricing power is mixed, and hiring appetite is ebbing. Second, the capex supercycle around AI is real, balance-sheet backed, and large enough to offset some macro softness, particularly in regions that can secure power and permitting. Third, growth is spilling outside of big tech into utilities, industrial equipment, construction/engineering, and the semiconductor complex, creating a web of beneficiaries that does not show up fully in diffusion-style surveys but does in order books and guidance.
This is why the next twelve to eighteen months will likely feature a split screen for investors. On one side, you’ll see more months where manufacturing PMIs oscillate around contraction and services barely expand. On the other, you’ll see periodic step-ups in reported capex and a steady cadence of site announcements—from hyperscaler campuses to grid upgrades—because the physics of AI workloads are not optional. If you want latency to fall and throughput to rise, you buy land, build substations, and stack accelerators. The spending isn’t happening because sentiment is ebullient; it’s happening because the business case already exists.
For our strategy, this dual reality matters. It argues for caution in interpreting ISM as a stand-alone signal of future earnings, and it validates a barbell between structural beneficiaries of the AI build and those parts of services that can sustain margins despite softer hiring. It also argues for watching a set of hard data—utility interconnect queues, regional transmission approvals, semiconductor equipment bookings, and disclosed campus megawatts—alongside the soft surveys. The surveys catch the weather. The capex plans tell you where the climate is headed.
The Consumer, Rewired by AI
Consumers are still spending, but the pattern feels uneven, almost lumpy, and increasingly dominated by software. July’s advance retail and food services sales rose 0.5% month over month and 3.9% year-over-year, a respectable pace considering softer hiring and headline-driven angst. Peel the layers and you see autos were strong, non-store (online) retail advanced again, and heavy promotion windows amplified e-commerce. Restaurants slipped a touch, and building materials cooled—signs that discretionary service outlays and interest-rate-sensitive projects remain more fragile than the headline suggests. The underlying impetus was clear: promotions (notably Prime) and targeted digital funnels nudged households to click, even as they grew warier about the outlook.
The University of Michigan’s August preliminary survey fell to 58.6 from 61.7 in July, with current conditions down notably and expectations softer; inflation expectations ticked up, too. In other words, mood cooled even as carts filled. The Conference Board’s July reading moved up to 97.2, but respondents’ views of current job availability were the weakest in roughly four-and-a-half years—a nuance that squares with your labor-market section about a cooling jobs engine. Taken together, “soft” data say caution; “hard” data say the register still rings—especially online.
Housing sits in the middle of this tug-of-war. July housing starts jumped to an annualized 1.43 million units (+5.2% m/m), with single-family at 939k (+2.8% m/m). Permits slipped overall but improved slightly for single-family, a split that mirrors builder comments about selective strength. Mortgage rates have eased off their highs—MBA’s survey shows ~6.6% on the 30-year fixed in mid-August, the lowest since October, but still elevated enough to constrain move-up demand. Housing isn’t collapsing, but consumers need more rate relief—or income growth—to unlock broader activity.
On household balance sheets, the New York Fed’s Q2 Household Debt and Credit report quantified what many feel: balances climbed another $185B to a record $18.39T. Credit card balances rose $27B to $1.21T, auto to $1.66T, and mortgage to $12.94T. Delinquency edged up to 4.4% of outstanding debt in some stage of delinquency; student loans saw a sharp rise in 90+ day delinquencies (10.2%) as paused reporting fully resumed. Transitions into serious delinquency were largely stable for cards and autos, edging up for mortgages/HELOCs. It’s a picture of stress pockets rather than a wave: debt service is doable for many, but the margin for error has thinned for rate-sensitive and younger borrowers.
Crucially, the NY Fed’s Survey of Consumer Expectations (July) suggests attitudes and behaviors are adjusting at the margin. One-year inflation expectations ticked up to 3.1% (from 3.0%), five-year to 2.9% (from 2.6%), while three-year held 3.0%. Households felt a bit better about their current and year-ahead finances, perceived credit access deteriorated slightly (though expected future access improved), and the mean probability of job loss nudged to 14.4%. Consumers aren’t exuberant; they’re pragmatic—rationally bargain-hunting in promos, leaning into channels that deliver value and convenience, and adjusting expectations as prices prove sticky.
Retailers are no longer experimenting at the edges—they’re deploying AI at scale to personalize discovery, optimize inventory, and compress delivery times. Amazon’s “Rufus” shopping assistant is now embedded across the U.S. experience, guiding comparisons and nudging conversions inside the funnel. Walmart is rolling out AI for task management, real-time translation in 44 languages, and broader “super-agent” initiatives that streamline store operations—steps that free associates to focus on higher-value work and reduce friction for shoppers. Target continues to push AI across forecasting and merchandising as it works through a turnaround. The cumulative effect is subtle but powerful: promotions land when and where they’re most persuasive, stockouts fall, and delivery windows tighten—all of which help explain why online categories outperform even as sentiment oscillates.
The two-way link—the consumer’s impact on AI and AI’s impact on the consumer—is now self-reinforcing. Households vote with clicks, rewarding the retailers that reduce friction and surface value precisely when wallets feel stretched. In turn, those same retailers pour more capital into the AI stack, expanding the very capabilities that drew consumers in. That’s why July looks the way it does: resilient spending in autos and e-commerce, caution around rate-sensitive durables, and a restaurant plateau that may ebb and flow with gasoline prices and wage growth. The next 1–3 years will likely intensify this loop. If rate cuts restore some housing affordability and wage growth stabilizes, AI-enabled retailers will be positioned to capture incremental share quickly; if not, their optimization engines may still squeeze better outcomes from flat nominal demand. Either way, the consumer’s 2025 experience is increasingly an AI-mediated one—and that shows up in both the receipts and the surveys.
Sector Leadership—YTD and the Last Three Months
This has been a year of narrow-but-powerful leadership punctuated by periodic rotations. On a year-to-date basis, the industrial complex has quietly rivaled—or in stretches, surpassed—tech in driving returns, led by aerospace & defense and power equipment tied to AI data-center buildouts and reshoring. By mid-July, Industrials were the top-performing S&P sector in 2025, up roughly 15% YTD, about double the broader market at that point—helped by outsized gains in defense names and grid-equipment specialists. That theme has persisted into August even as day-to-day leadership has chopped with macro headlines.
The other surprise leader over the last one to three months has been Utilities. July’s sector dashboards show Utilities putting up some of the strongest monthly gains, a notable change from their long defensive slump. What changed isn’t just rates: it’s the market waking up to structural electricity demand from the AI buildout—multi-gigawatt campuses and heavier baseload needs—plus transmission and interconnect spending that stretches well into 2027–2029. Utilities’ rerating is uneven, but the direction of travel (more capex, better rate-base growth visibility) has put a floor under the group in recent weeks.
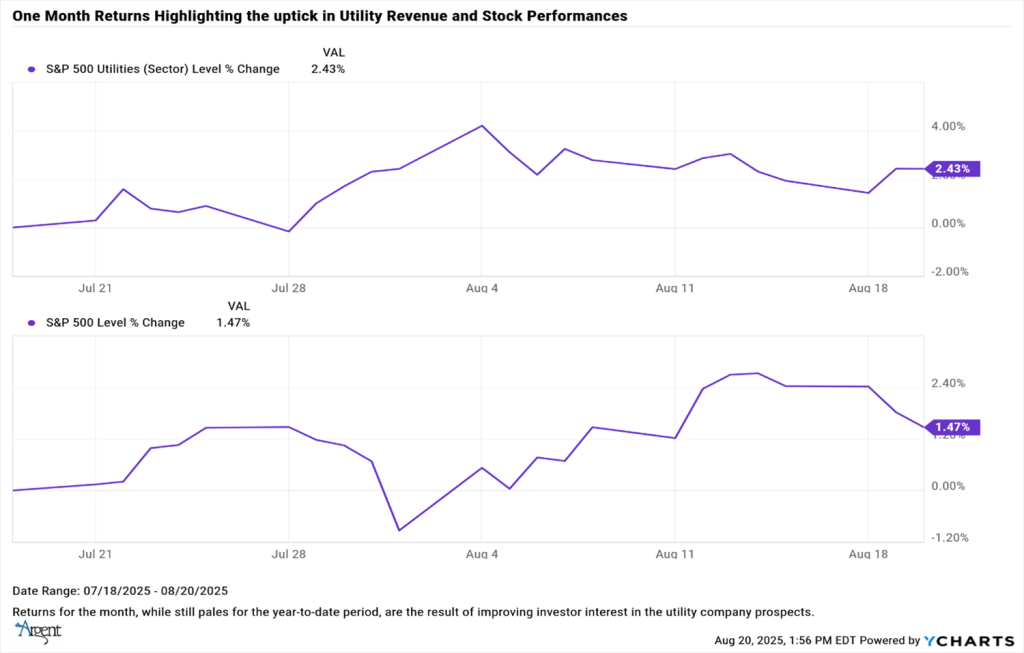
Technology still anchors the index, but the concentration risk has become extreme. Tech’s weight near one-third of the S&P 500 (and closer to mid-40s if you roll in platform companies slotted in other sectors) means market-cap winners continue to overpower breadth—even as multiples expand and capex needs climb. That concentration is why pullbacks in a handful of names can yank the tape, even in otherwise healthy-breadth days.
On the lagging side, Health Care has been an underperformer year-to-date—hurt by managed-care volatility, cost overhangs, and policy risk—even as select pockets (obesity/diabetes therapies) defy the trend. As of early August, the S&P 500 Health Care sector continues to materially trail the index. Consumer Staples and Utilities have underperformed over the longer arc since the 2022 bottom, reflecting investors’ preference for growth and operating leverage; that defensive underweight is now where value hunters are starting to look.
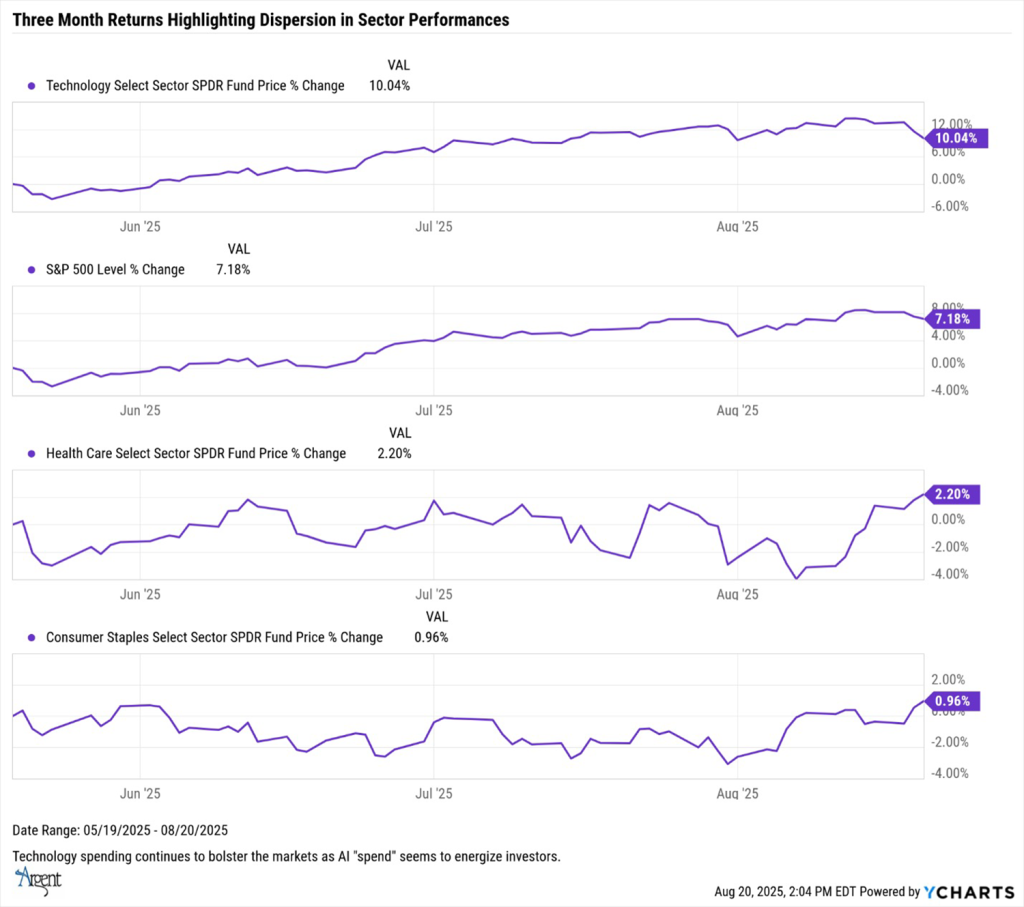
The follow-up: AI capex is bleeding into old-economy winners (grid, power equipment, and construction engineering) while the megacap platform model continues to concentrate returns. The tape is resilient, but leadership is still narrower than a classic mid-cycle expansion.
Small Caps vs. International—Who’s Winning, and Why
In the U.S., small caps have lagged YTD, with the Russell 2000 up only ~1–2% versus a high-single-digit S&P 500—though they’ve shown sharp catch-up bursts on rate-cut headlines (e.g., +3% on Aug. 12, best day since May) and posted a strong week into Aug. 15. The pattern fits the macro: heavy debt loads and higher marginal funding costs kept a lid on small-cap multiples; any credible path to lower policy rates tends to spark swift relief rallies.
Internationally, Japan has been the standout: Nikkei and TOPIX at record highs as a weaker yen boosts exporters and corporate reforms continue to unlock returns. Europe is positive YTD but choppier—helped by banks when rates fall and hurt when tariff/policy headlines bite. India has oscillated near records, with flows tied to reform hopes and domestic growth; near-term swings have come from tariff risk and earnings. The mosaic: Japan/Asia ex-China leadership, Europe middling but improving in spurts, EM selective.
Strategically, the spread between U.S. mega caps and U.S. small caps is still wide by historical standards; if rate cuts arrive on schedule and credit eases, small-cap operating leverage could surprise to the upside. Overseas, yen weakness and corporate governance tailwinds keep Japan compelling; Europe likely needs clearer growth and tariff visibility to sustain leadership.
Closing & Positioning—Artificially Intelligent
Why this likely isn’t Y2K, redux: The late-1990s burst was predominantly software standardization and telecom overbuild—broad but often revenue-light until the consumer internet matured. Today’s cycle starts with clear, measurable use cases (query costs, coding assistance, fraud detection, fulfillment routing) and capital budgets already committed at unprecedented scale. It is narrower in buyer count but deeper in dollars, and the economics of AI workloads (latency, power, memory bandwidth) force hard-asset spending that cycles through utilities and industrials—not just servers and switches. Put differently: in 1999 the spend was to be “Y2K-compliant”; in 2025–2028 the spend is to be competitive. Tech concentration risk is real, but the downstream beneficiaries (grid, thermal, specialized industrials) broaden the opportunity set—and that wasn’t true in the same way during Y2K.
The economy can wobble, surveys can soften, and the labor market can lose a step; yet the corporate decision to wire AI into the operating core is already made. Boards have approved budgets while bulldozers move dirt and substations are being plotted long before ribbon cuttings. That is the backdrop investors are really trading, even as headlines oscillate between “rate cut soon” and “growth scare later.”
That tension explains why the market’s leadership has narrowed at times and why rotations have been choppy. It also explains why pullbacks around data surprises have been met by buying in those parts of the market where revenues and cash flows are most visibly levered to this buildout.
Consumers, for their part, are already living in this “artificially intelligent” economy. Promotions find them, not the other way around. Inventory is forecast with tighter error bands. Delivery promises are more reliable because routing is (or will be) smarter. If labor remains soft, productivity will need to carry more of the earnings load, and AI is the practical mechanism by which that happens in retail, logistics, healthcare, and insurance.
Not Investment Advice or an Offer -This information is intended to assist investors. The information does not constitute investment advice or an offer to invest or to provide management services. It is not our intention to state, indicate, or imply in any manner that current or past results are indicative of future results or expectations. As with all investments, there are associated risks and you could lose money investing.


