


BY: Tom Stringfellow, CFA®, CPA®, CFP®
Chief Investment Strategist
Strength In Numbers
- The odds of the first-rate cut of 25 basis points (1/4%) are now 50%, and it has been pushed out until September.
- Core inflation readings declined from 3.8% to April’s 3.6%, the largest monthly decline since September 2023. Although 3.6% is still higher than the Fed target, core inflation is at its lowest level since 2021.
- On a year-to-date basis, market sector returns have moved in tandem. Technology is no longer in the lead but rather is behind both communication and utility sector stocks.
- With 96% of the S&P companies reporting for Q1 2024, 78% of those companies have reported positive earnings surprises, while 61% have reported positive revenue surprises.
Sell in May and Go Away
Economic data has a significant impact on market direction, as do corporate earnings and investor perspectives on the underpinnings of both the economy and business outlook. These factors, in addition to trend outliers, such as market seasonality, helped term the phrase “sell in May and go away.”
Looking at S&P 500 returns over the past 25-year period (ending in 2023), there may be some occasional validity to the concept, given that the average monthly return during the time frame between May and September was about 0.19%. That is certainly a five-month detractor from the average annual return (with dividends reinvested) of 9.88% over the prior 25-years.
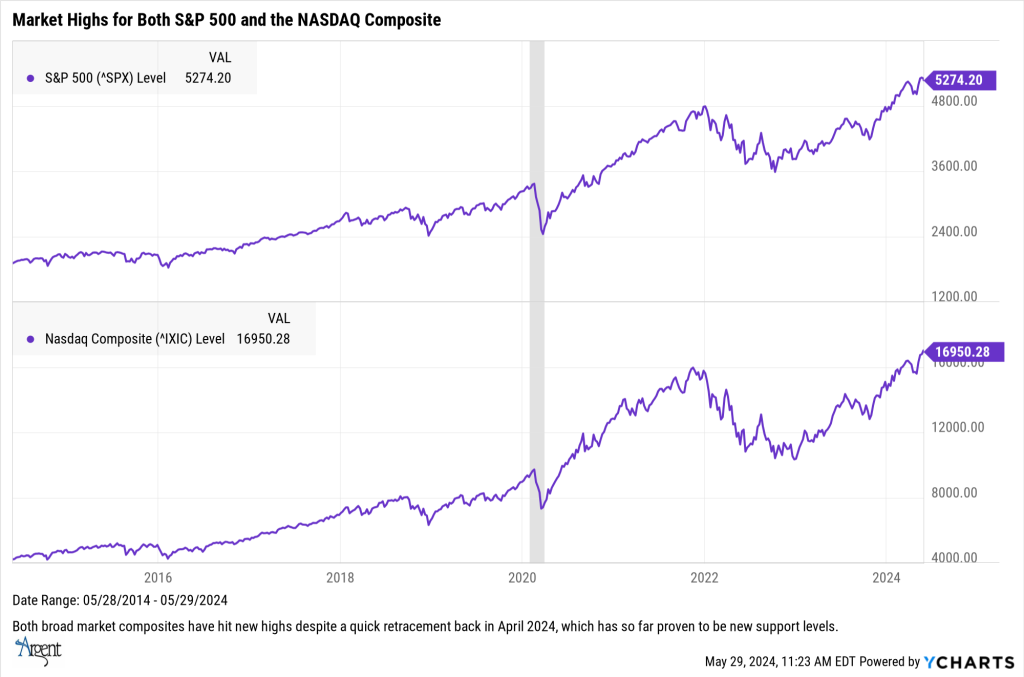
This month and, for that matter, this year have both started off on a different note. On a year-to-date basis (May 24), the price level return for the S&P 500 posted a positive 11.21%, while so far, May is up 5.71%. These results were achieved against the backdrop of 11 rate hikes since March 2022 and a still uncertain path for the first potential rate cut.
However, the Fed continues to add a bit of rhetoric to fuel investor uncertainty. In Fed Chair Powell’s May 1 press conference, he reminded market watchers that the central bank would raise rates if necessary. But he also still believed that monetary policy was restrictive enough to bring down inflation and that the next move for interest rates would be lower, not higher. Those comments were sufficient enough to push “expectations” down the road a bit more as today’s odds for a “no-rate-cut” is about 40%, up from 27% a week earlier.
Investor sentiment has, however, managed to bypass Fed rate concerns, and to date, it has significantly contributed to market rallies that are driving stocks to new highs. But given the current rhetoric, the market’s path hasn’t been without considerable volatility, much of which is attributed to Fed commentary on the ongoing rate cuts and timing saga. Negative volatility was evident last April, as the S&P posted a negative 4.16% return for the month, which quickly rebounded by early May.
Even with the volatile rhetoric and sentiment swings, this year’s rally has been impressive. The market has broadened out despite market, global and domestic news, noise and uncertainties. At this writing, 71% of the S&P 500 stocks are above their 200-day moving average. By comparison, in October last year, 23% of the S&P 500 stocks were above their 200-day moving average, and in September 2022, only 10% of the S&P stocks fell above the 200-day moving average. As to the NASDAQ’s tech-focused universe, today, 60% of its stocks are above the 200-day moving average. In October last year, it was 24%, and in 2022, the June low was 11%.
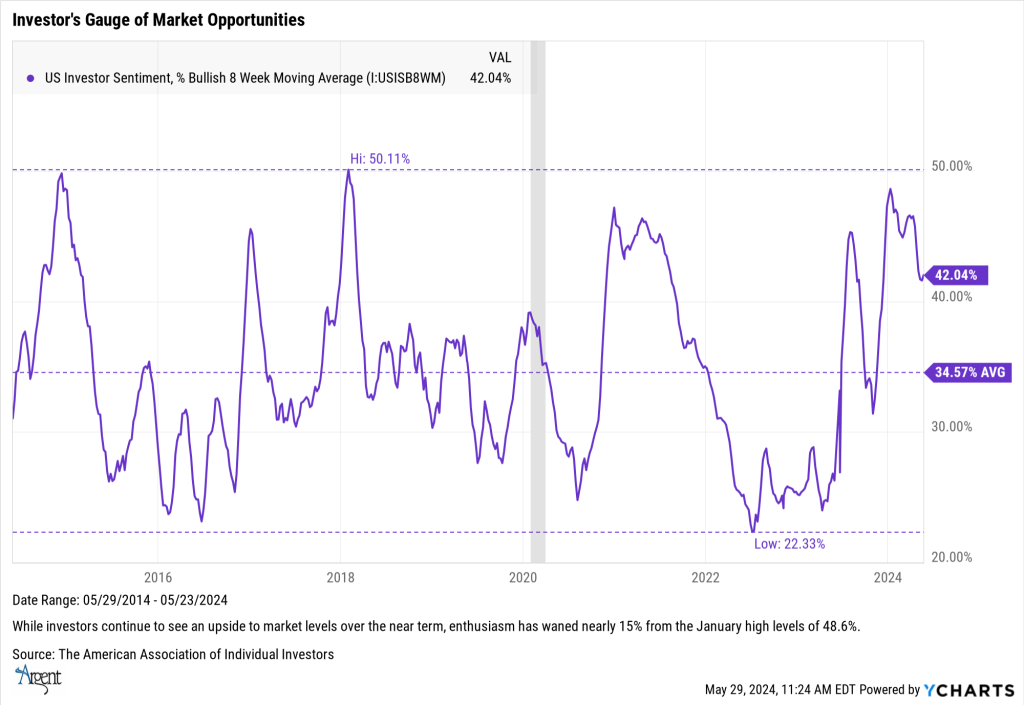
For now, though, sentiment and a bit of positive economic data (or trends) tend to guide the market’s course. Three primary indicators, including the AAII Investor Sentiment Survey, the Investors Intelligence Advisor Sentiment Survey, and the CNN Fear/Greed Indicator are all in positive territory, although not yet pushing up into the more contrarian worrisome markets-at-risk scenario.
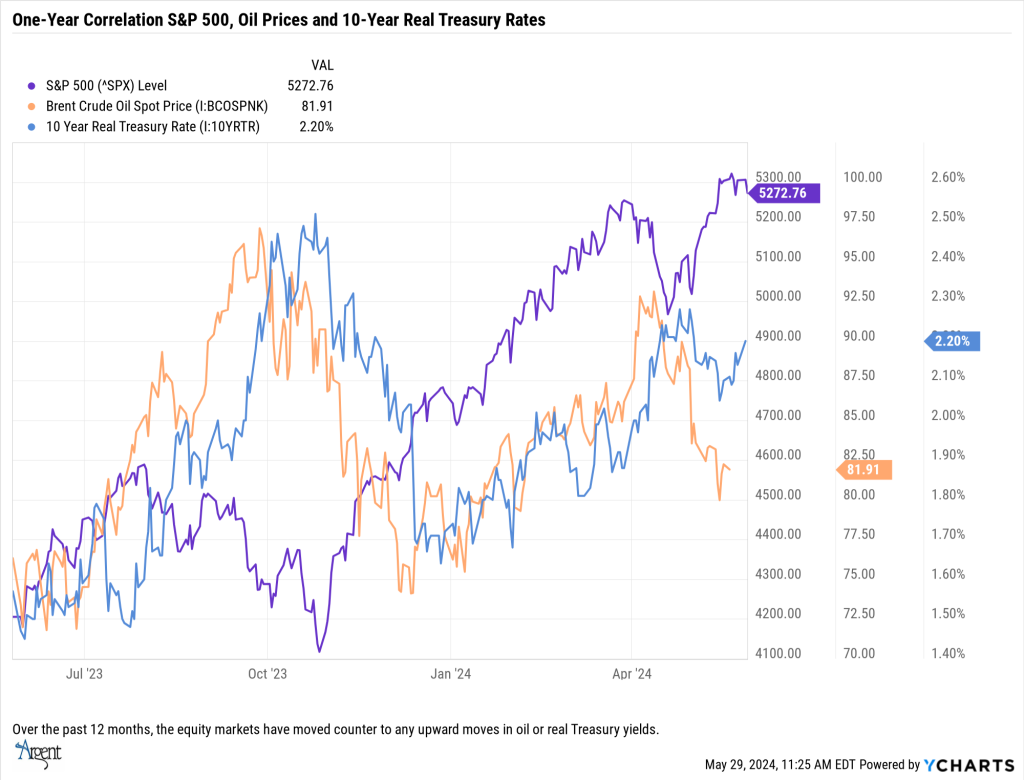
In considering recent economic data, trends in inflation growth and the business outlook have also contributed (or supported) today’s market levels. As an example, we still have a rather “tame” longer-term outlook on inflation which has helped drive oil from near $97 levels last October to the current $82 level.
Likewise, real 10-year Treasury yields have continued to decline from an October 2023 high and April’s spike—periods when equity markets and investors were overly “stressed,” as reflected in the market sell-off.
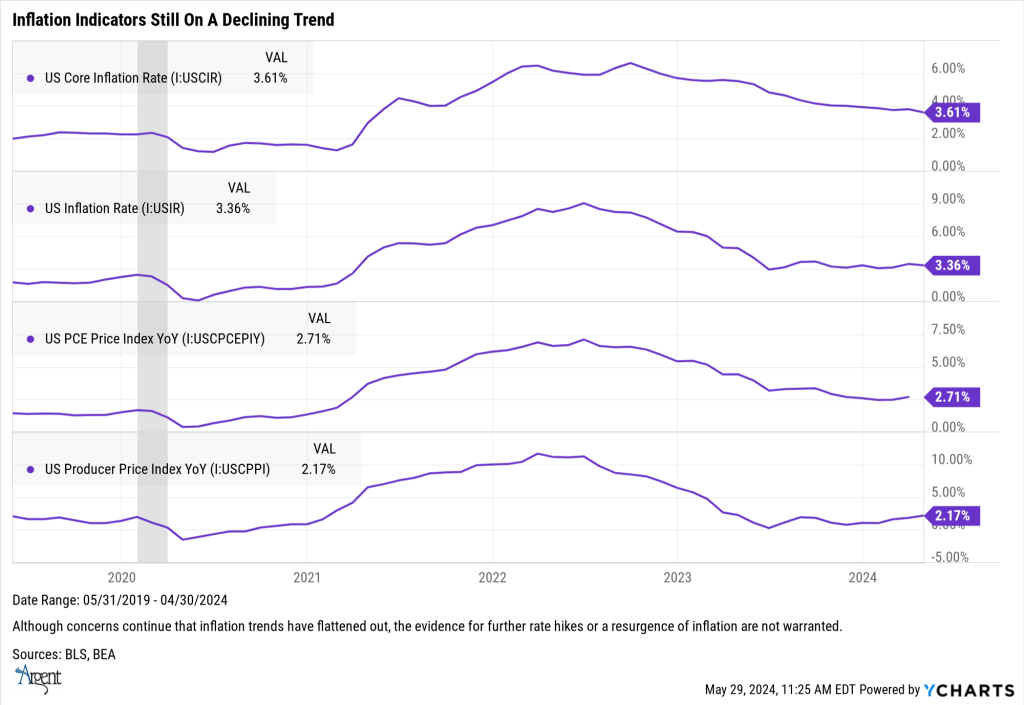
On the inflation front, trends are still pointing to a slowing down in price levels, although not at the speed the Fed or investors would like to see. While inflation remains a bit higher on an absolute basis, recent data from the regional Fed price surveys are reminders that economic growth is slowing, but not at a rate that should cause recessionary worries. Actual year-over-year inflation readings continue to indicate a persistent decline in activities that have been contributing to inflation growth.
- A particularly important data point from earlier this month was flat retail sales growth fueled by a decline in spending on gas, autos and building materials.
- Also important, the Empire and Philly manufacturing surveys both declined, with new orders falling into negative territory, all pointing to a slowdown in growth ahead.
- April’s industrial production was weaker than expected and essentially flatlined for the month. This weakness is expected to be visible in the upcoming Producer Price Index reading as well.
- Core inflation readings declined from 3.8% to April’s 3.6%, the largest monthly decline since September 2023. Although 3.6% is still higher than the Fed target, with 12 declines over the past 13 months, core inflation is at its lowest level since 2021.
Resilient Consumer
The Fed just released their Economic Well-Being of U.S. Households in 2023 survey which featured an interesting take on today’s consumer perspectives. The 2023 survey found self-reported financial well-being was nearly unchanged from the prior year. It further showed that many adults continued to point to higher prices as a challenge, though measures of the labor market in the survey, such as finding a job, were strong.
Key findings from the report about how people were faring financially in 2023 are below:
- Inflation continued to be the top financial concern despite the inflation rate falling over the prior year. Thirty-four percent of adults said their family’s monthly income increased in 2023 compared with the prior year, while a higher 38 percent said their monthly spending increased.
- Forty-eight percent of adults reported spending less than their income in the month before the survey. The share of adults who saved money in the month before the survey was similar to the share in 2022 but down from highs in 2020 and 2021 and below pre-pandemic levels.
- The rates at which workers started new jobs, applied for new jobs and received pay raises were similar to 2022.
- Sixty-five percent of adults said that changes in the prices they paid compared with the prior year had made their financial situation worse, including 19 percent who said price changes had made their financial situation much worse. Meanwhile, 31 percent said price changes had little to no effect on their financial situation.
- The share of adults who applied for credit has been nearly unchanged in recent years. Yet, among adults who applied for credit, the share of those who were denied credit or approved for less credit than they requested was up 2 percentage points from 2022 and up 5 percentage points from 2021.
- Challenges paying rent increased in 2023. The median monthly rent payment was $1,100 in 2023, up 10 percent from 2022. In addition, 19 percent of renters reported being behind on their rent at some point in the past year, up 2 percentage points from 2022.
- Eighty percent of retirees said they were doing at least okay financially—a higher share than for U.S. adults overall.
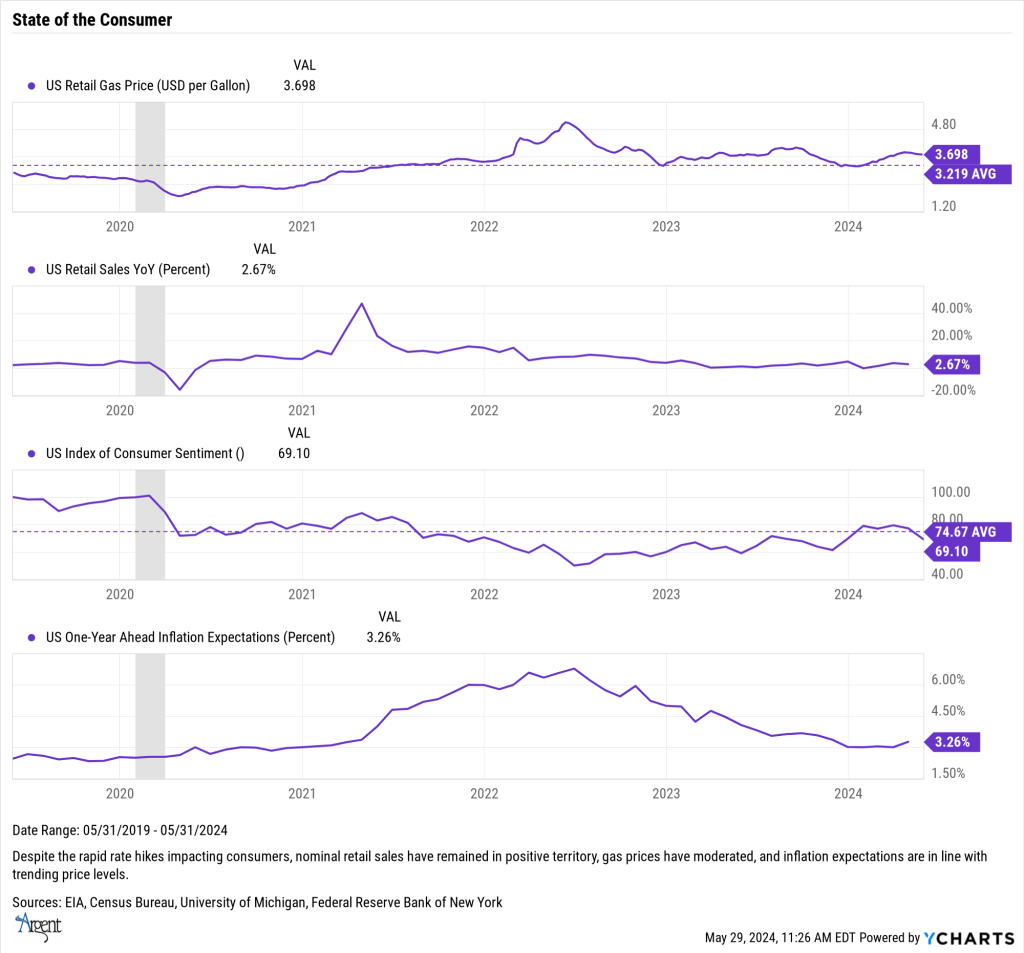
With respect to more current customer activities, there was a slight slowdown in recent retail activity with April’s headline sales posting relatively flat. Stripping out auto retail sales, total sales reported for the month was up 0.2%, this versus sales growth last April 2023 of 3.0%.
One of the more volatile categories, online sales, was one of the larger detractors of the seven negative sales growth categories, off 1.2% for the month. The largest sales growth category was at the gas station, as recent gas price spikes drove fuel pump sales up by 3.1% for the month. Other growth categories were clothing (+1.6%), food and beverage stores (+08%) and restaurants/bars (+0.2%).
One interesting follow-up to the lackluster sales report was that retailers are finally sensing that their ability to pass higher price levels on to the consumers is losing steam. Given the slowing in retail sales and retailer efforts to maintain market share, a few large chains, including Walmart, Target, Wendy’s and McDonald’s, have now begun to roll back prices. I suspect more will be coming on that front over the next few weeks.
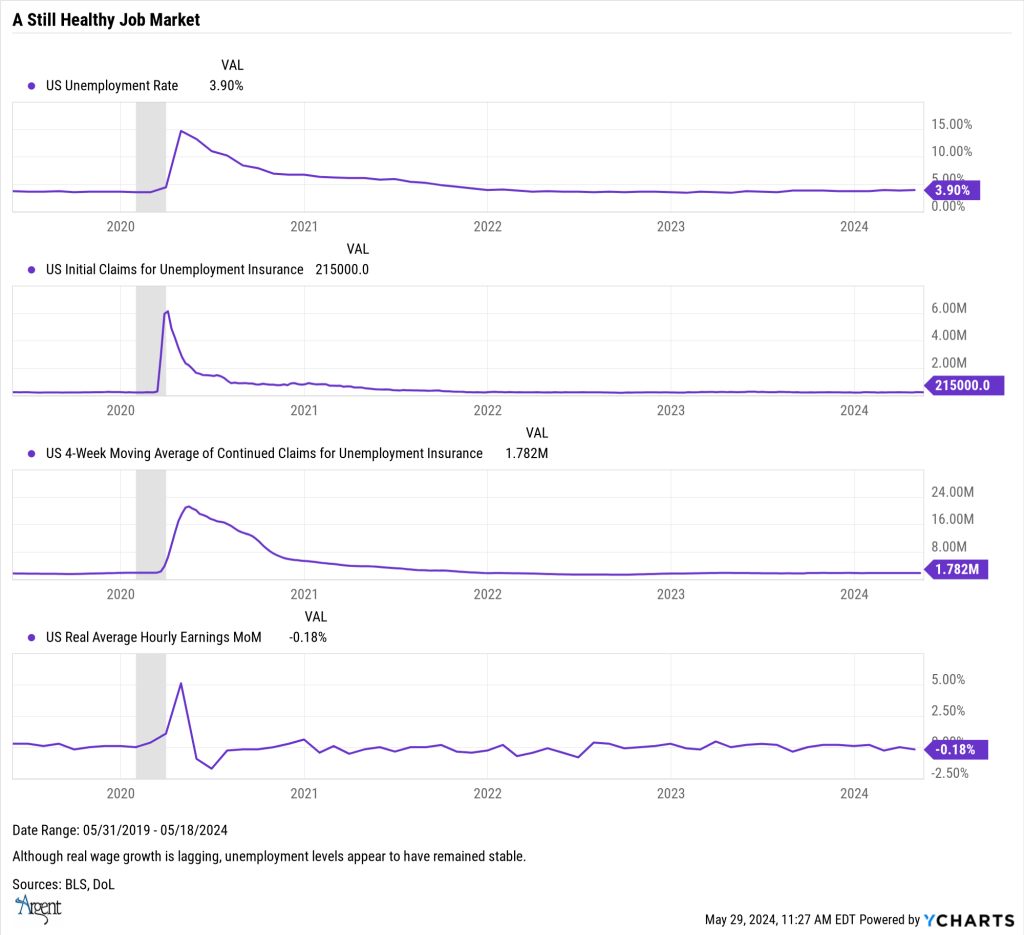
Again, the housing and job markets are somewhat of a mixed bag. Despite some softening in the job market heralded by an increasing number of layoff stories, initial jobless claims data have remained relatively stable at around the 200,000 range.
- Given the latest May 18 reading of 215,000 initial jobless claims and an unemployment rate of 3.9%, the overall job market remains solid.
- Total nonfarm payroll employment increased by 175,000 in April–lower than the monthly average gain of 242,000 over the prior 12 months.
- Net gains in employment were primarily in health care (+56,000), transportation and warehousing (+22,000), retail (+20,000), construction (+9,000), social assistance (+31,000) and government (+8,000).
On the housing front, the good news is that the majority of housing price increases are likely subsiding. Meanwhile, rental vacancy rates are on the rise while new rents are beginning to soften. Also, the good news is that as of April, inventories of existing homes have risen to their highest level since December 2020.
With a 3.5 months’ supply in existing home inventories—at current prices—we are at the same month’s supply of inventory levels as late 2019 (but quite a bit more expensive).
Regarding apartment rental prices, certain areas of the country are experiencing year-over-year declines in rents, primarily in the Sun Belt cities, primarily due to rapidly expanding multifamily inventory. This includes Austin (-7.4%), Raleigh (-4.4%) and Orlando (-3.9%). This easing should continue and broaden through the year as we expect to see the newest apartment completions in several decades.
One last positive news item is that May’s Conference Board’s Consumer Confidence Index improved by several percentage points from an Index level of 97.5 last month to the current 102. In that context, consumer expectations also hit a three-month high.
Market Trends and Volatility
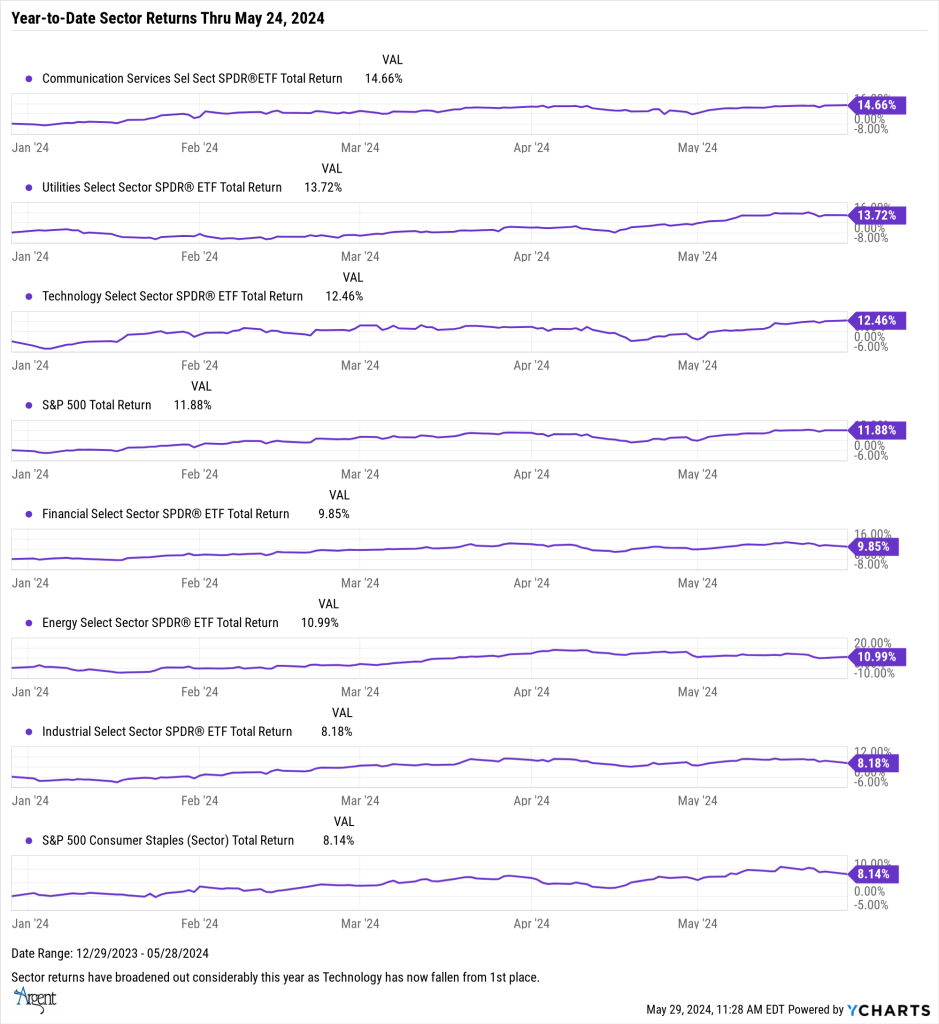
With a few exceptions, as the breadth of the market improved this year, sector strength this year was fairly broad based. As an example, at one extreme the real estate sector was the biggest laggard for 2024, while from a stock perspective, one of the shooting stars of the technology sector was Nvidia, up a total of 115% through last Friday (May 24). But despite those outliers, most sector returns were in a rather tight cluster.
Since the beginning of the year, the S&P 500 posted returns of 11.85%, with technology stocks only slightly ahead, with a positive of 11.98%. Surprisingly, the utility sector took second place, posting 13.83%, and in first place were communication stocks, up 14.46%. Close behind, though, were the financial, energy, industrial and consumer staples sectors. The only losers for the first five months (not shown) were consumer discretionary stocks (-1.62%) and real estate stocks (-6.13%).
One potential reason for the improving breadth of the market participation was company earnings. As has been the case for some time, street estimates once again understated the direction and magnitude of earnings.
- With 96% of the S&P companies having now reported for Q1 2024, 78% of those companies have reported positive earnings surprises, while 61% have reported positive revenue surprises.
- According to FactSet data, the number and magnitude of earnings surprises are not only above their 10-year averages but also, on a year-over-year basis, the S&P is reporting its highest growth rate since Q2, 2022.
- Estimates for the full-year 2024 revenue and earnings growth call for increases of 5.0% and 11.4%, respectively. For 2025, expect revenue and earnings growth of 5.9% and 14.2%, respectively. Again, don’t be surprised by missed estimates.
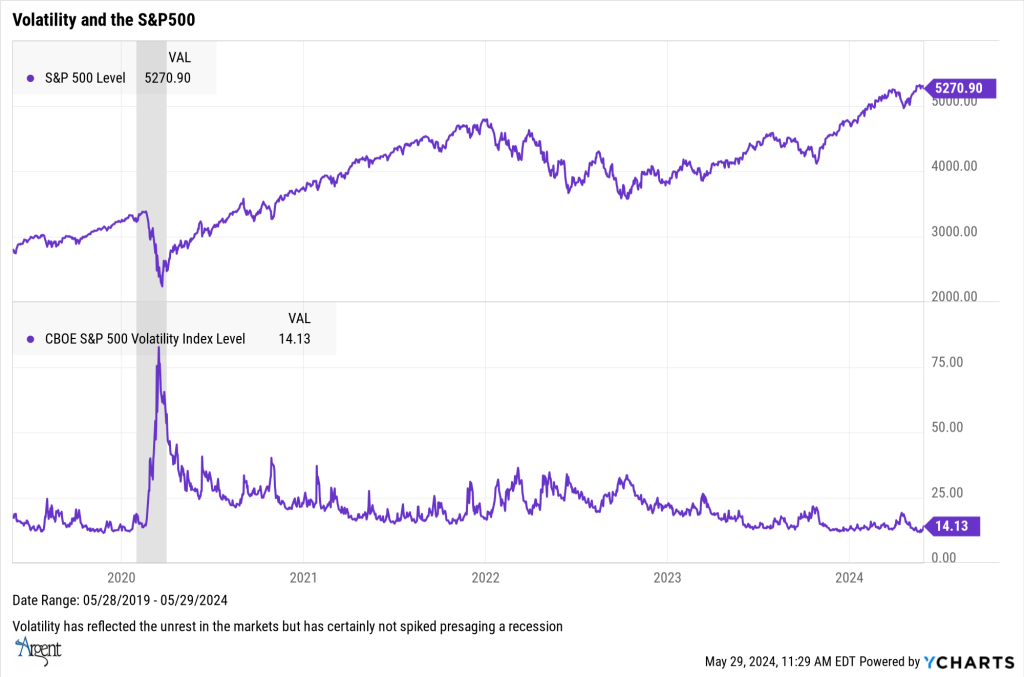
Another interesting market variable has been the recent levels of volatility underlying the market. The CBOE Volatility Index (VIX), a real-time measure representing investor expectations for near-term price changes of the S&P, has fallen by nearly 63% since the post-pandemic market rally. Because it is derived from short-term SPX price options, it provides a clue of the expected level of volatility over the next 30 days.
The index is also a way to gauge the degree of market fear among investors. Today, the VIX level has continued to slide during this year’s market rally, and today, it is approximately one-half of the level just one month ago—that time frame when the S&P was off 4.16%.
One significant risk to the market today, as measured by the VIX indicator, is that a quick shift in market sentiment can create a sell-off, which, no matter how temporary, may leave a few investors with bruised portfolios in the wake. The VIX index is not only one way to gauge market momentum but also investor sentiment. Today, there are quite a few bullish investors.
Forward-Looking
Following several unexpectedly higher inflation readings, Fed officials are now wavering as to how much longer it might take to bring inflation down to their targeted neutral interest rate level of 2%. As Fed policymaker’s rhetoric changes, so does the market probabilities for the first rate cut. Earlier this month, the probability of a September rate cut was close to 80%; now, the odds have dropped to roughly 50%.
And while the latest VIX index level is a reminder that investor optimism may have risen faster than the odds for a rate cut have fallen, the question is whether we have moved closer to a recession risk environment—or have investors become too “impatiently” optimistic.
The latter is most likely the case. While economic data has certainly started to show consistent signs of economic momentum stress, much is the result of still too stubborn higher rates impeding home sales and, more recently, credit card usage regret.
From a market perspective, the other issue is that investors are constantly trying to second-guess the Fed’s next move. This, in turn, has provided one of the underlying “whip-saw” risks in the market and, hence, a near-term historically low VIX reading.
On a positive note, the economy is still relatively healthy, regardless of the scary headlines. We are now seeing an uptick in corporate earnings across multiple sectors, industries and companies that is being reflected in stock performances and investor sentiment. The economy is still (or will be) experiencing solid GDP growth, falling inflation levels, strength in the growth areas of the market (technology) and expectations for a future rate cut.
The job market remains solid despite nominal increases in initial unemployment claims. Positives include monthly increases in economically critical jobs within industries such as construction, transportation, medical, manufacturing and professional.
Retail sales, one of the more comprehensive indicators of consumer spending, declined more than expected earlier this year, but there was no evidence that U.S. consumer spending was materially slowing. Consumers are also actively traveling (evidenced by airline, cruise, hotel and vacation bookings). Credit card debt levels, however, are becoming worrisome, especially at current charge card interest rates.
The markets are broadening out as investors see more opportunities, even outside of technology. While valuations are currently stretched for some companies, the new Artificial Intelligence (AI) emphasis will attract new efficiencies, revenues and opportunities. The challenge, though, will be distinguishing corporate fact from fiction.
There will be some short-term volatility, however, mostly predicated on investor sentiment on the timing of the first rate cut. Shifting expectations will create volatility, but when the first rate cut happens, it is not as important as the fact there is a rate cut (or two) in the market’s future.
Upcoming election rhetoric and debates will be creating volatility as well. As investors, our focus remains on the fundamentals of the markets and the companies participating in the economy’s growth. Volatility will create longer-term portfolio opportunities.
Not Investment Advice or an Offer -This information is intended to assist investors. The information does not constitute investment advice or an offer to invest or to provide management services. It is not our intention to state, indicate, or imply in any manner that current or past results are indicative of future results or expectations. As with all investments, there are associated risks and you could lose money investing.

