


BY: Tom Stringfellow, CFA®, CPA®, CFP®
Chief Investment Strategist
- On a year-to-date basis, the major market indexes are at, or near, their all time highs. The S&P 500 is up over 14% and Nasdaq, over 18%.
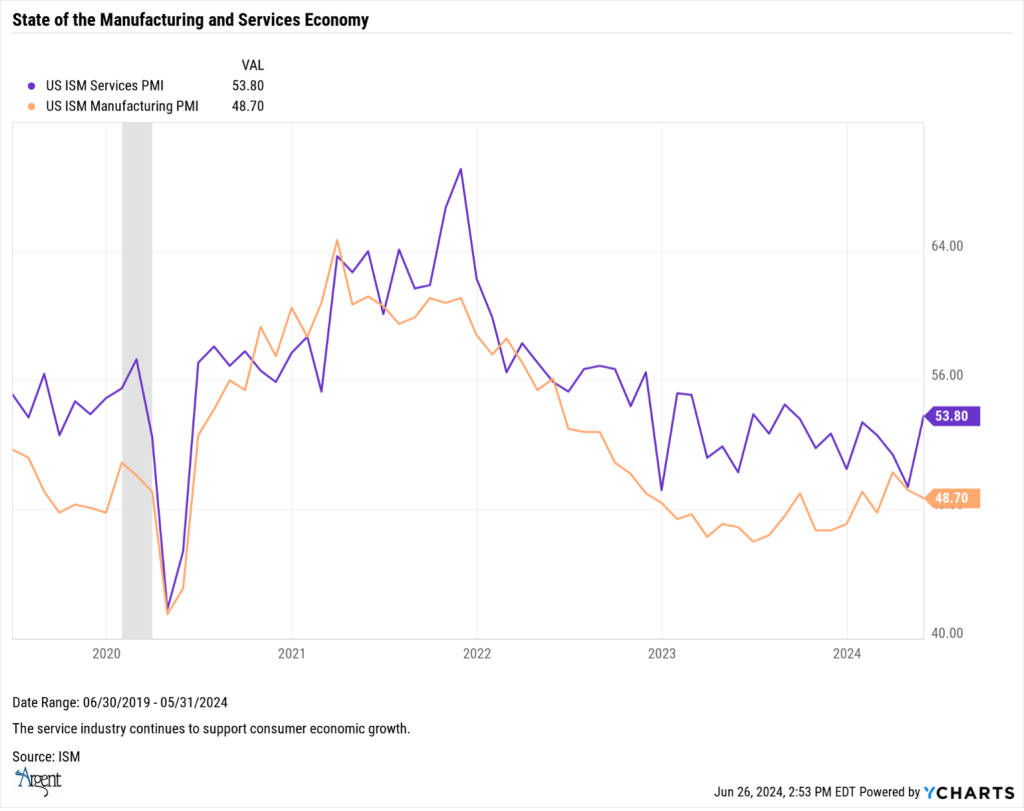
- Within the business surveys, the ISM Services PMI index is one of the few that highlights a relatively strong business environment with an index reading of 53.8, firmly in expansion territory.
- Artificial Intelligence (AI) visibility is certainly the market driver this year. Although companies like Nvidia are the posters for AI, the drive toward this new technology is expanding into all industries. Just ask Siri or Alexa.
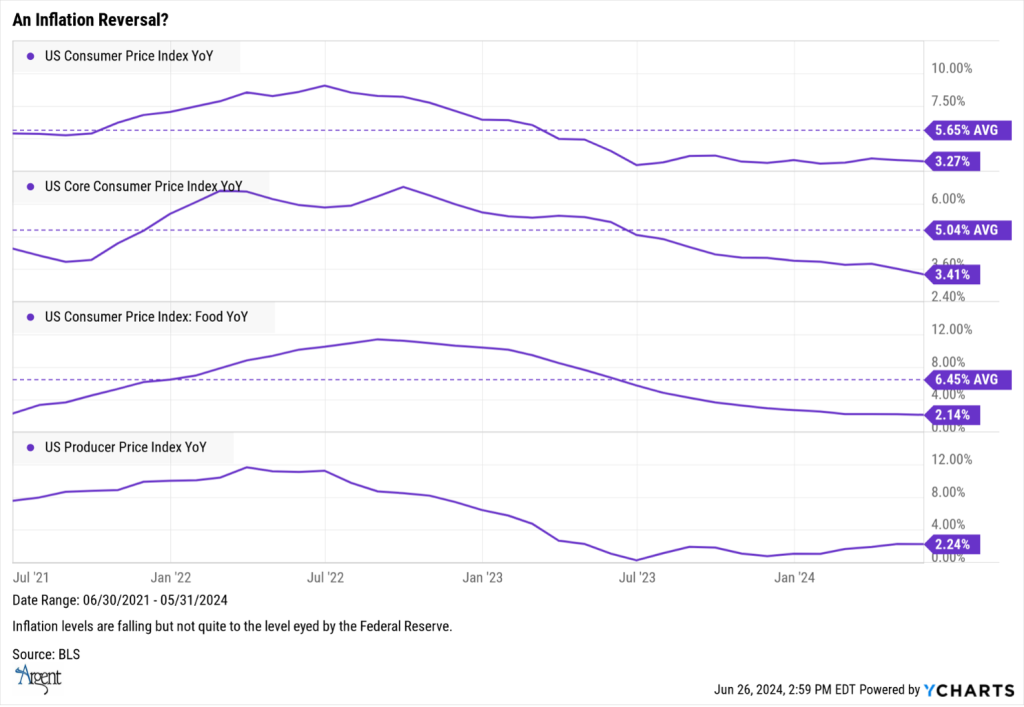
- Inflation has yet to drop to levels prescribed by the Federal Reserve, and the key components (except housing costs) seem to be falling more in line with the Fed mandate.
Market Backdrop Changing
While writing this commentary following the June 25 market close, the S&P 500 is up more than 14% year-to-date. This year’s rally has been a byproduct of job stability, declining inflation, expectations for at least one more rate cut this year, and a meandering but improving economic backdrop. Perhaps the biggest single driver of this broadening market growth, however, has been the boom in AI (Artificial Intelligence); companies need only mention the term AI to gain quick investor interest. The company Nvidia remains one of the more expensive poster children representing AI-company stocks.
To date, the stock market has yet to be negatively impacted by higher rates, although periodic fluctuation occurs when a Fed official suggests potential rate cuts are being pushed further down the road. Markets believe the Fed will cut rates sooner rather than later, and the likelihood of any rate hike has been removed. Even with recent concerns about mixed economic growth and the potential for a slowdown or stall, the bullish momentum that has driven the market higher since the beginning of the year seemingly remains intact.
Although economic growth has experienced some loss in momentum because of higher interest rates, the slowdown has not scared investors away. However, there have been hints of investors trimming back their technology-centric focus toward more value-oriented companies. Meanwhile, companies across various sectors, including food companies such as Wingstop, Campbell Soup, Domino’s and Panera Bread, are incorporating AI tools, looking for the next growth engine to reduce costs, change market dynamics or improve efficiencies.
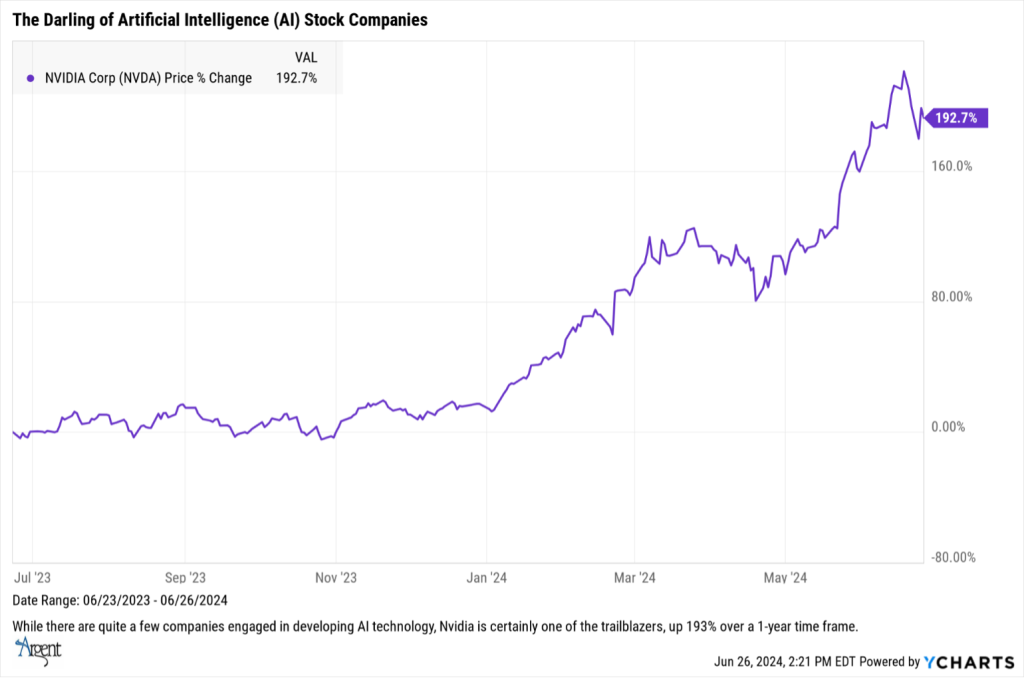
Frankly, the stock market has held up just fine without rate cuts, for now. The major U.S indexes (S&P 500, Nasdaq and Dow Jones Industrial Average) are at near historic highs. However, higher rates for much longer still run the risk of derailing what has been an otherwise remarkable recovery from the pandemic lows of a few short years ago. The Artificial theme can carry the economy only so far and will not help improve mortgage rates or housing inventory. Whether we see any loosening of interest rates this year depends on the Federal Reserve’s assessment of economic conditions. So far, public comments from several regional Fed presidents have unfortunately advocated for more pushback for lowering rates until next year.
Manufacturing Surveys
Different surveys can paint different stories and this is also the case within the manufacturing industries. Take for example the headline S&P Global Flash US PMI Composite Output Index, posting its highest since level of output after a continuous upward push over the past 17 consecutive months.
The Institute for Supply Management (ISM) paints a slightly different story, noting that economic activity in the manufacturing sector contracted in May-notching 18 monthly declines over 19 months and with the index reading of 48.7, this does not represent a robust manufacturing environment. Where there is growth, however, is within those industries involved in energy, mining, chemical and paper products. Which to some extent represents future manufacturing resourcing.
The services sector did however take a different path with the Services PMI reading at 53.8%, representing an expansionary environment. This survey also provided a more optimistic perspective in terms of improving inventory sentiment, new orders index, and order backlogs, which are representative of notably higher business activity. Challenges noted included both controlling expenses and finding qualified labor.
In looking at both reports, there is a mixed message that points to growth in those industries that cater to the real estate market, utilities, transportation, finance and insurance, agriculture, hotels and mining. What appears to be missing are the heavy manufacturing related industries. The latter necessary for sustainable economic growth and development. A more stable rate market coupled with an improving (global) business outlook would certainly help reverse the trend.
Inflation Slipping
One of the more sensitive inflation barometers, the Core Price Index (CPI), decelerated in May to the slowest monthly pace in nearly three years, according to last month’s CPI release. This inflation number was the best we’ve seen in months, beating estimates and rising “only” 3.4% year-over-year from April’s 3.6% reading. The softer inflation report was further confirmed by the Producer Price Index (PPI), which showed a monthly decline of 0.2%. Categories contributing to the reduction in producer price costs included slight declines in transportation (-1.4%) coupled with a more meaningful drop in energy prices (-4.8%). While these reports were positive, they also indicated a clear downward pressure on price levels, suggesting that selective price disinflation might be on the rise.
Examining specific price changes in the Consumer Price component, used car and truck prices fell 9.3% year-over-year, marking the largest decline in fourteen months. However, this improvement was offset by higher auto insurance prices, which increased by 20.26% over the prior year. Shelter costs, while beginning to stabilize, were still up 5.4% last month. The index for food is well off its 2021 highs and is broadly moving sideways, while energy prices are well off their June 2022 highs, driven by the war in Ukraine.
Overall, while inflation is clearly declining, this past month’s data also suggests a potential slowdown in economic growth in select categories. This mixed economic picture highlights both progress in managing inflation and ongoing challenges in maintaining economic momentum.
Drifting Retail Sails
In contrast to other economic measures, May’s recently released retail sales slightly missed expectations but showed a still-positive year-over-year increase of 2.3%. This growth rate has not kept pace with inflation. Adjusted for inflation, real retail sales have been negative on a year-over-year basis for four of the last five months and 14 of the prior 19 months. Although current levels are not close to those seen in prior recessions, they do indicate trending weakness in consumer spending.
The monthly report does show, however, that out of the 13 retail categories, eight still report category growth. Leading on a month-over-month basis is the sporting goods sector, up 2.7%. Clothing sales improved (less than 1%), but other growth categories were well below the 1% hurdles. Those categories included food and beverage stores, bars, restaurants, building materials and furniture—all with modest monthly gains. The lead category, though, was non-store/online sales, up by 0.8%, and on a year-over-year basis, ahead by 6.8%. And while online sales have consistently outpaced the growth rate of other sales categories, online shopping momentum has also shown some signs of slowing.
May’s takeaway report is that through last month, retail sales have yet to point toward an economic slowdown. Even so, decelerating growth adds to the growing list of economic concerns, suggesting a potential need for easing policy interest rates—something the Federal Reserve hopefully takes into consideration in its late July meeting.
Hiring Remains Steady
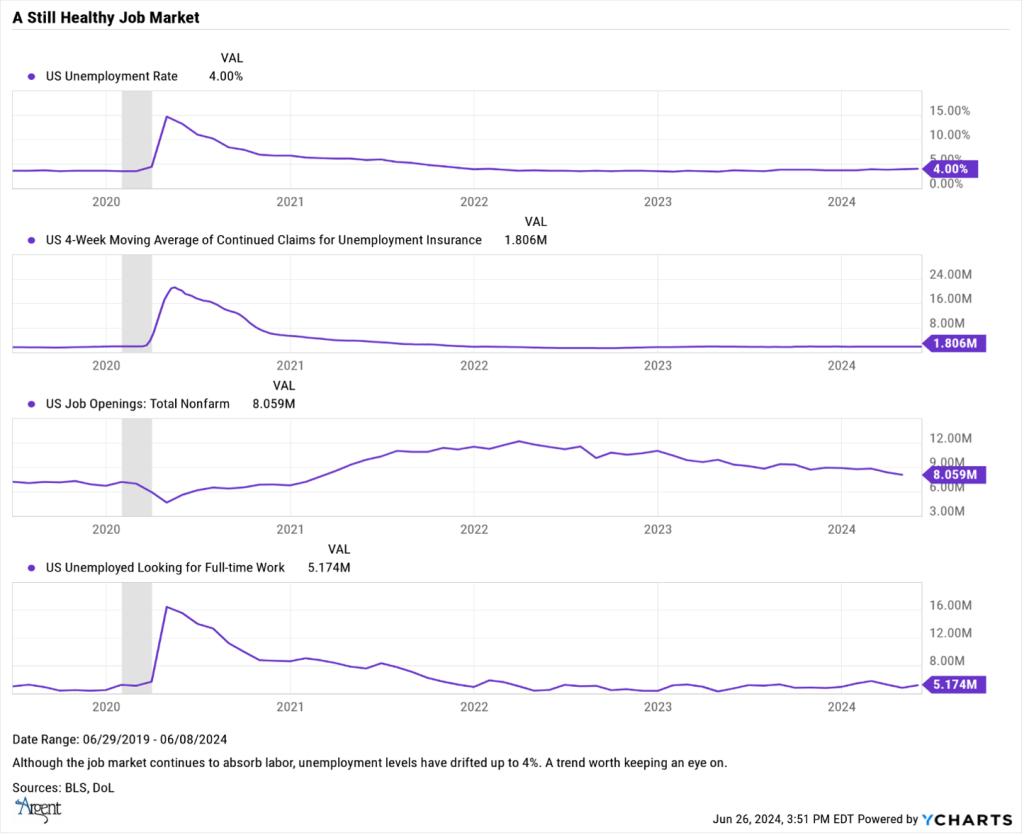
The employment rate has held steady at 4%, with 6.6 million people unemployed, and shows little change from May. A year ago, the unemployment rate was slightly lower at 3.7%, with 6.1 million unemployed. Notably, 1.4 million of the unemployed were long-term unemployed, representing nearly 21% of the total unemployed population. Additionally, 5.7 million people not in the labor force currently want a job.
Despite the slight increase in the unemployment rate, total nonfarm payroll employment saw a significant increase of 272,000 jobs last month, surpassing the average monthly gain of 232,000 over the prior two months. The healthcare sector contributed notably to this growth, adding 68,000 jobs, consistent with its average monthly gain of 64,000 jobs over the past year. Government employment also showed strength, increasing by 43,000 jobs, though slightly below its average monthly gain of 52,000. As has also been the case in prior months, the leisure and hospitality industry added 42,000 new positions while the food and services industry continues an upward trend, adding 25,000 new employees.
Overall, the unemployment situation appears stable. The slight uptick in the unemployment rate may concern some economists, but the steady growth in nonfarm payroll employment suggests a resilient employment landscape. Wage growth has also held steady over the past 12 months, with average hourly earnings up 4.1% from the year earlier.
Homes (and Buyers) Needed
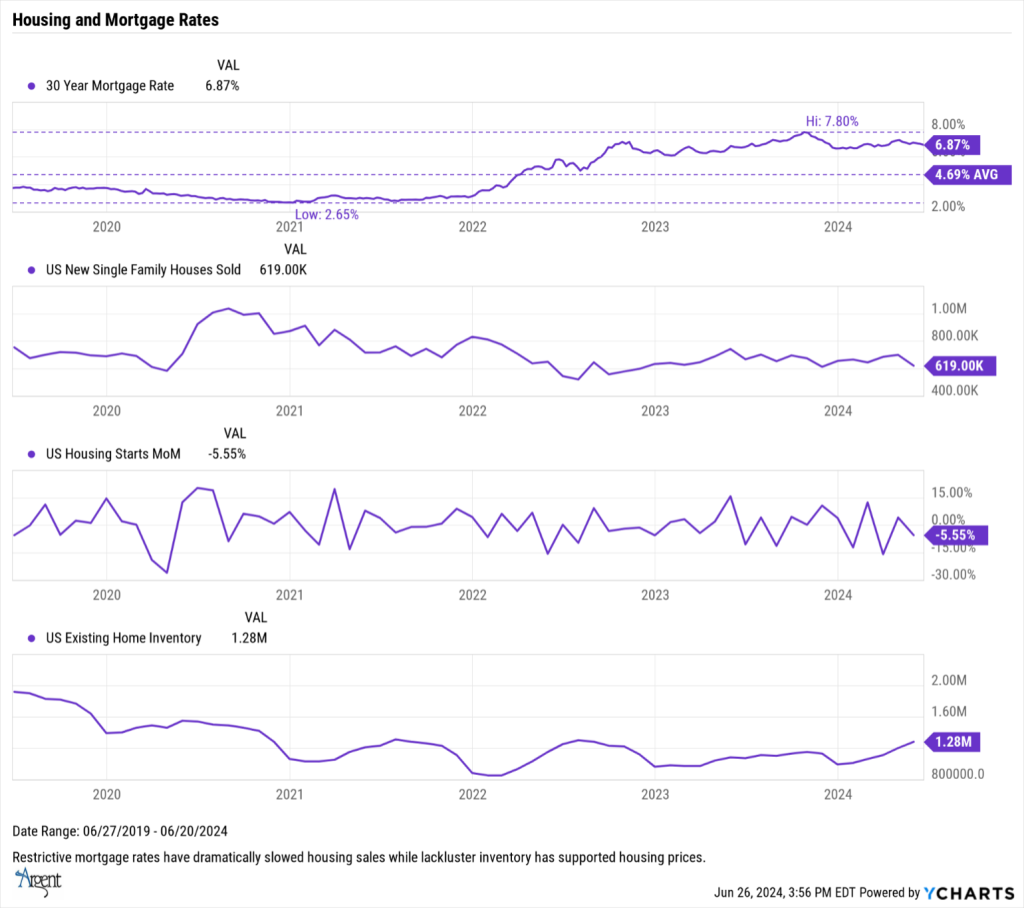
Throughout the past few weeks, the 30-year fixed mortgage rate has declined to the current 6.9%, booking the first meaningful drop below 7% mortgage rates since March. Unfortunately, purchase demand has been modest despite the decline. Mortgage loan applications did increase by 1.6% this past week but were lackluster compared to an 8.6% increase the week before.
The recent report on housing starts and building permits was also disappointing as both headline readings fell short of still modest expectations. Nearly every metric had weakened, notably multifamily starts, down over 40% year-over-year. Last month’s, building permits also posted their third consecutive monthly decline, down 3.8%, the fourth decline in five months. Building permits have been at their lowest levels since June 2020. Single-family permits also softened, dropping 18.5% over the prior three months.
A potential positive note: With mortgage rates now trending below 7%, more future homeowners may be encouraged to begin house hunting again. However, according to the National Association of Home Builders, most homeowners have still opted to stay in place to avoid trading homes with higher mortgage rates. This trend is driving home prices higher and resale inventory lower, with today’s housing inventory equating to about a 3.7-month supply, compared to 3.5 months last month and 3.1 months a year ago.
Overall, the housing market shows mixed signals. While a drop in mortgage rates below 7% might stimulate future demand, sliding builder sentiment and declining building permits suggest ongoing challenges. These obstacles were reflected in last month’s sales data, as home purchases are off 2.8% lower than a year ago. One interesting data point, though, is that first-time buyers still account for 31% of housing sales, slightly down from 33% in April but up from 28% in May 2023.
Time in the Market (Versus Market Timing)
The largest stocks in the S&P 500 have been the primary drivers of the market. According to Bespoke Research, the combined market cap of the 30 largest stocks in the S&P 500 now accounts for more than 50% of the index. This is a notable increase from 25 years ago, during the peak of the dot-com bubble, when the 30 largest stocks comprised only 42.2% of the index.
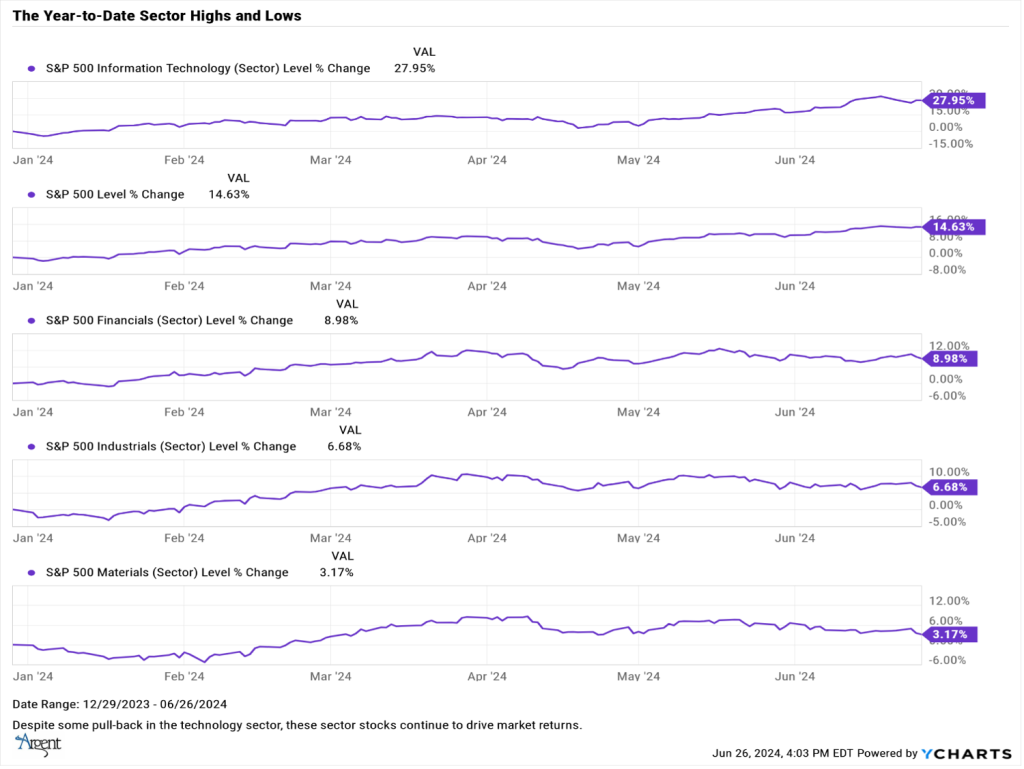
The technology sector’s relative strength has surged over the past couple of months. In contrast, sectors such as financials, industrials, and materials, which performed well in the first quarter, have lagged—a relatively new phenomenon in recent years, as these sectors have typically shown extreme drops in relative strength in an otherwise rising market environment. Such moves are not sustainable, and the pullbacks can be severe.
The continued outperformance of the U.S. stock market relative to the rest of the world has been propelled by stocks such as Nvidia, Apple, and Microsoft. Today, the combined market cap of U.S. companies constitutes nearly 50% of the world’s stock market cap, according to Bloomberg. During the global bull market of the early 2000s, the U.S. lost significant market share, dropping to roughly 25% of the world’s market cap at the beginning of the financial crisis. Since then, the U.S. stock market has recovered and now holds a record share.
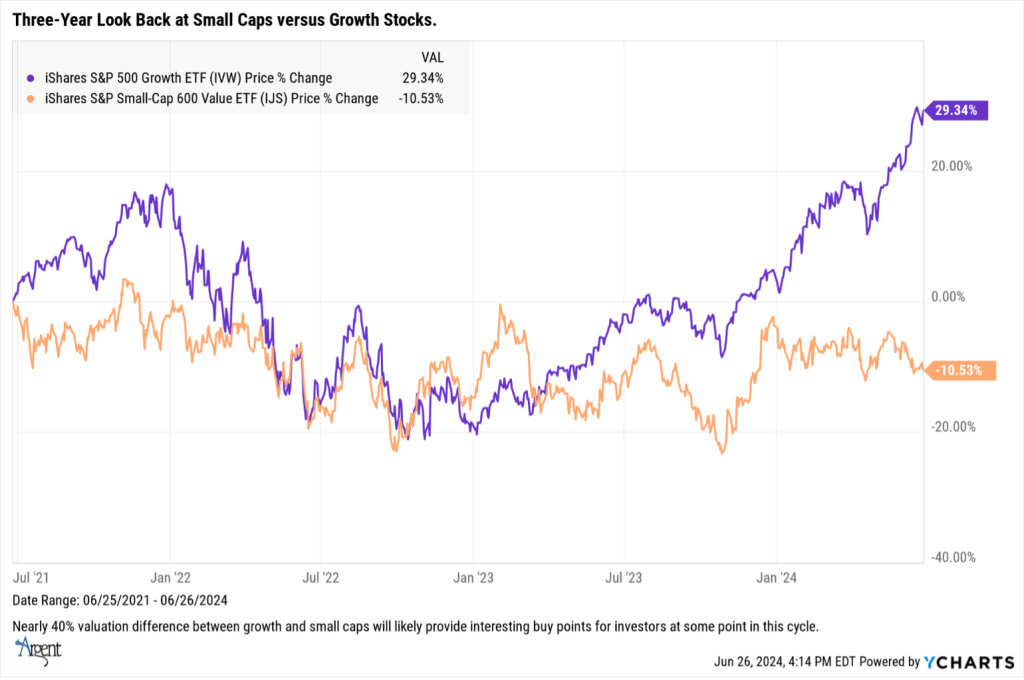
What is intriguing about the current state of the U.S. market across market caps is the dispersion between large-cap growth and small-cap value stocks. Over the past five years, large-cap growth stocks, as represented by the ETF IVW, have gained nearly 30%, while the small-cap value ETF, represented by IJS, is down more than 10%. Previously, these stocks moved in tandem, but over the last year, particularly in 2024, the gap has widened dramatically, underscoring the importance of diversification across market caps. Over market cycles, investors should remind themselves that cash ultimately flows to extremely undervalued assets. Small caps might be find a bid in the near future.
This trend is also evident when comparing the S&P 500 market cap-weighted index to the S&P 500 equal-weighted index. Over the past three decades, these two strategies have generally followed each other, sometimes falling behind and then reverting to the lead. However, in recent years, the disparity between the two has become extreme. It appears that there is now some reversion back to the equal-weighted S&P stocks, which tends to place less emphasis on heavily tech-weighted stocks and more emphasis on a broader spectrum of the market.
Closing Thoughts for the Month
No doubt the market today looks expensive. Through today’s close (June 25), the forward 12-month price-to-earnings ratio (P/E) of the S&P 500 is trading at just over 21 times earnings. These levels were last seen in 2022, just before interest rates began their upward climb.
In truth, investors have quite a bit on their plate, including a number of economic concerns generally tied to inflation—housing, energy, food and utility costs—coupled with the overall fear that the Fed won’t cut interest rates because inflation may remain at current levels given “stickiness” at current price points.
Adding more fuel to the fire is the politics of this election season. We are now in the final inning before the debates, voting and market anxiety begin. Each potential presidential candidate brings different market and economic perspectives, which would likely have different market impacts. We are following these issues closely. And, of course, what appears to be a further escalation in a number of war zones across the globe unsettles everyone involved, though oftentimes, not the markets.
Offsetting the negatives:
- The economy has continued to surprise to the upside, although more sporadically these days. The labor market remains persistently strong, and the latest GDP estimate from the Atlanta Fed for Q2, 2024 is 3.0%. Numbers are above trend and well above the forecasted recessions several quarters ago.
- Interest rates will come down—hopefully not as a result of downward spiraling economic growth but rather a stabilization of inflation fears.
- As much as the AI revolution has hyped up the stock market, real economic synergies exist, which should dramatically improve efficiencies in a number of industries and global markets. There are cost savings and revenue streams that the markets have yet to fully calibrate.
- Corporate earnings are improving. Factset data estimates that year-over-year earnings growth in 2024 is expected to be in excess of 11% with next year’s earnings growth rate expected to post an increase upward of 14%. For the most part, these estimates include a broadening in earnings growth (and market returns) across a much wider market spectrum—attributes necessary for healthier markets and economies.
Not Investment Advice or an Offer -This information is intended to assist investors. The information does not constitute investment advice or an offer to invest or to provide management services. It is not our intention to state, indicate, or imply in any manner that current or past results are indicative of future results or expectations. As with all investments, there are associated risks and you could lose money investing.

