


BY: Tom Stringfellow, CFA®, CPA®, CFP®
Chief Investment Strategist
Past, Present & Future
• The S&P 500 and Dow Jones Industrial Average both closed at their respective new highs on January 19.
• Inflation continues to soften a bit, with headline CPI dropping to an annualized 3.4%, core CPI to 3.9% and PPI to 1%.
• Investor expectations for future rate cuts in 2024 might be a bit more ambitious than the Fed’s three-cut forecast.
• Consumer sentiment measured by the Michigan Consumer Index jumped to a reading of 78.8, the highest since July 2021.
• The employment rolls continue to be a stabilizing anchor for the economy, with unemployment levels still holding at 3.7%.
Market Highs
The S&P 500 ended last week (January 19) by closing at an all-time high, with investors energized and still convinced meaningful rate cuts would begin sooner rather than later. Market momentum was most evident in the technology sector (XLK), which also helped both the Nasdaq and Dow Jones Industrial Averages push through to their own all-time records on Friday as well.
The start of this year has been quite a change from the roller coaster of the past few years. Since 2020, the markets have been anything but normal following a pandemic-fueled recession, near zero interest rates, imbalanced labor markets/supply chains, and rapidly rising interest rates. During that period, there was a bear market in 2020, an equity boom in 2021, a bear market again through October 2022 and a wild market ride throughout 2023. Today, investors are counting on the premise that the 11 rate hikes beginning in March 2022 and continuing through July 2023 are on the verge of being reversed.
Following the pandemic shutdown and through 2023, quite a few geopolitical headwinds have roughed up the markets. Even so, those headwinds have yet to cause any meaningful derailment of the U.S. economy. We have commented in the past about the initial impact of the Russia and Ukraine war on food and oil prices, but as the conflicts escalated, economic disruptions settled a bit.
In the past few months, we have added to the mix of military conflicts involving Israel, Yemen, Pakistan and potentially a host of other nations. Any of these conflicts have the ability to disrupt national economies, lives, and given the region, oil prices. Most recently, however, the markets have looked beyond these events, but for how long this remains true is uncertain.
Today, the U.S. economy appears to be on the mend, having posted a Q3 annualized GDP growth rate of 4.9%. In a few days, on January 25, the first estimate for Q4 2023 will be released as well. The current estimate from the Atlanta Fed GDPNow model is projecting a 2.4% growth rate, which may very well be a low estimate. Factoring in this past quarter’s still strong employment as was the case with retail sales and activity in the service-related industries. The housing market also appears to be in the early stages of recovery (building more inventory with added supply providing price relief). Inputs that will soon be reflected in upcoming estimates.
Investors today are, however, overly bullish, with expectations of an economic soft landing “assured.” Investors are also counting on potentially six rate cuts this year, strong corporate earnings and probably a smooth election year. Whether or not these all come to pass—along with some successful peace initiatives overseas—remains to be seen. It is an election year, and typically that is a market positive, although the wager is still out on how smooth this election year will actually be.
As we’ve seen in the past, though, markets do tend to work through the noise of presidential cycles. But investors could be overly optimistic to expect six rate cuts this year. If the Fed fails to see further success in bringing down core inflation levels, it will likely push out the number of rate cuts and their timing.
Balancing Fed Expectations, Inflation and Rate Cuts
So far, progress on inflation has been remarkable, considering that in June 2022 Consumer Price Index (CPI) inflation rose to 9.1%, the highest reading since November 1981. By last month, the level had dropped to 3.4%. The story is similar across the inflation spectrum, including core inflation and the Producer Price Index (PPI). In March 2022, PPI (measure of inflation at the wholesale level) was an annualized 11.7%, and by last month, the growth rate had fallen to 1%. Likewise, core inflation (CPI less food and energy) posted an annualized inflation growth of 6.6% in September 2022, but last month’s reading was 3.9%.
 With CPI now in a range that shows significant progress toward bringing inflation levels to the Fed’s desired 2% level, the key question is to what extent current CPI levels make expected and priced in future cuts more likely. Recent FOMC minutes projected that the Fed expects rates to come down this year, but the outlook for timing was more uncertain. The answer, as usual, was and is data dependent.
Regardless, the Fed’s forecast for three rate cuts this year remains, and any incremental cuts would likely be welcomed by investors. If six cuts were in the offing, investors would likely view the effort now as “too-much-too-late,” an attempt to offset the overly aggressive rate hikes that commenced in 2022 and continued through the middle of 2023.
The Consumer: Confidence On the Rise
Another interesting data point from last week was Michigan’s Consumer Index reading. Sentiment was stronger across the board, with the Index reading of 78.8 at its highest since July 2021 and its largest monthly increase since December 2005. One standout was the Current Conditions component. Up by 10 points, it was the largest increase in 10 years. A few underlying reasons explained the pivot, including:
- According to New York Fed’s latest Survey of Consumer Expectations, survey respondents were less pessimistic about how their financial situation fared from the prior year and into the year ahead. Those who viewed their situation as worse than the prior year also fell to the lowest level since 2022.
- The perceived probability of losing one’s job next year has marginally decreased to 13.4%. Concurrently, there is a slight increase in the probability of voluntarily leaving a job, up to 20.4%, along with a marginal rise from 55.2% to 55.9% in the perceived chances of finding a new job if the current one is lost.
- The median expected growth in household income decreased slightly to 3%. However, this reading remained above the pre-Covid 19 pandemic level of 2.7%. Notably, perceptions regarding households’ current financial situations have improved, with fewer respondents feeling worse off than a year ago.
- The probability of an interest-rate increase in the next 12 months fell to 25.9%, the lowest since November 2021. In addition, there was a marginal increase in the expectation of higher stock prices in the next 12 months, to 36.7%.
- Also helping was an approximate 20% drop in gasoline prices from September’s high of $4 a gallon to this past week’s $3.18 a gallon.

Jobs: A Stabilizing Economic Anchor
The U.S. Labor Department’s recent update of Job Openings and Labor Turnover (JOLTS) further reaffirms the notion that labor markets are still strong. JOLTS data showed nearly 8.8 million job openings at last count, well ahead of the number of unemployed still actively looking.
Meanwhile, with the December unemployment rate continuing to hold at 3.7%, the number of unemployed remains relatively stable at 6.3 million. And while last month’s unemployment rate was a bit higher than the prior December’s 3.5% level, it did not detract from the 216,000 new job additions for the month. As for the full year 2023, new payroll additions amounted to 2.7 million, an average monthly gain of 225,000. Pre-pandemic, average new job growth between 2016 and 2019 ranged between 176,000 to 195,000 new monthly job additions.
The source of new job additions in December:
- Government employment increased by 52,000, averaging 56,000 jobs per month in 2023, more than double the average monthly gain of 23,000 in 2022.
- Employment in leisure and hospitality changed little in December, up 40,000, averaging 39,000 jobs per month in 2023, less than half the average gain of 88,000 jobs per month in 2022.
- Health care added 38,000 jobs, averaging 55,000 per month in 2023, compared to a monthly gain of 46,000 in 2022.
- Construction employment added 17,000 jobs, averaging 16,000 jobs per month in 2023, a little different than the 2022 average monthly gain.
- Additionally, weekly jobless claims dropped to a multi-month low at 187,000 while continuing claims also declined. There is simply little to no evidence that the labor market is deteriorating.

Consumer Resilience
December was another strong showing from consumers. Retail sales for December exceeded expectations for the sixth straight month, adding to the longest streak of better-than-expected reports since 2001. Retail trade sales improved 0.6% over November and 4.8% from last year, while non-store retail sales were up 9.7%.
Although analysts were concerned that retail sales were losing momentum in October, the last two months of 2023 proved otherwise. According to National Retail Federation data, holiday sales during November and December reached a record of $964.4 billion, up 3.8% from the comparable period last year. As to the online sales component, according to Adobe Analytics, shoppers spent a record $222.1 billion.
Economists were expecting consumers to slow their spending in the latter part of 2023, given higher personal debt levels and declining savings rates. This was not the case, though, given a still strong labor market and rising wage levels. The U.S. consumer has continued to be one of the stalwart supporters of the economy, and this behavior is likely to continue well into early 2024.
With consumer spending now rising at a level higher than the current CPI inflation rate, it wouldn’t be surprising if March’s rate cut expectations don’t materialize until a bit later this year. Evidence of a still strong consumer, including labor market and wage growth, may be enough for the Fed to pause further monetary policy changes until there is more evidence of dampened inflation growth.
But on a positive note, with consumer spending the growth engine for the U.S. economy, this past month’s retail sales report is indicative of a still resilient consumer. As long as spending remains strong, the odds of a hard economic landing remains rather low.

Housing Pivot?
Last week was a busy period for housing data. One consistent factor for the housing markets these past two years was low housing inventory and diminishing affordability. This past month, inventories began to improve as have mortgage rates. In the past two months, mortgage rates have fallen from a high of nearly 8% for a 30-year loan to 6.6%.
As rates have begun to fall, mortgage purchase applications have been on the rise. For the week ending January 12, applications are up 9.2%, the highest level since last July. Still, there is quite a bit of ground to make up, though, as last year’s high prices and low inventory resulted in home sales dropping to their lowest level since 1995. Data from the National Association of Realtors noted that home sales were off 19% from the prior year, following an 18% drop in 2022. Meanwhile, the median home sales price in 2023 was up 1% from the previous year, averaging a bit over $390,000.
Housing inventory has improved somewhat from this time last year, up 4.2% from the prior December, representing just over 1 million available homes, or approximately 3.2 months of supply. Housing starts were up as well, increasing by 7.3% or an annualized 1.46 million new homes. Building permits were likewise up nearly 5.8% from the prior December and nearly 2% from the month earlier.
And good news about future housing inflation concerns:
- According to RealPage Market Analytics, the number of new apartments completed in the U.S. in 2023 rose to 437,000, the highest number of completed units since 1987. Forecasted completions in 2024 are estimated to be a new high of 672,000 units.
- Data from the Bureau of Labor Statistics (BLS) indicated that rents paid by new tenants have declined by nearly 25% from last year, comparing the annualized quarter-over-quarter period. Rent inflation appears to be on the decline as falling mortgage rates, improved builder confidence and tight housing supplies are sparking new construction and delivery.

The Financial Markets—the Difference A Year (or Two) Makes
It took two years for the S&P 500 to get back into positive territory following investors’ panicked selling in 2022. Recall that year, the Fed began an aggressive rate hiking regime, leading most investors to believe a potentially difficult economic landing (recession) was in the forecast. By June 17, the S&P had dropped nearly 23% as the Nasdaq dropped nearly 31%.
By the year’s end, the S&P had recovered somewhat, still down by 19%. The Nasdaq remained off by 33%. The following year, 2023, momentum kicked in as both indexes surged: Nasdaq closed 2023 with a return of 43% and the S&P, a positive 24%. By this past Friday’s close (January 19), the broader S&P had recovered from two years prior, up 1.54%. The Nasdaq still remains in negative territory for the moment.
Generally, once the S&P reaches a prior high, momentum moves the markets forward. However, concerns that perhaps the market is too expensive are valid, especially without more visibility of rate cuts, improving economic data and improving corporate earnings. But within the S&P there is a wide disparity based on market cap. According to data from Bespoke Research, the top 10 largest stocks in the S&P trade at an earnings multiple (P/E ratio) of nearly 27 times earnings, while the other 490 stocks are closer to a P/E multiple of 17 times earnings. Throw in mid-cap stocks (S&P 400) currently trading at P/E multiples of 15.7, or small-cap stocks (S&P 600) are trading closer to 14.7 times earnings, and valuation opportunities exist across the market spectrum.

In 2023, two underlying forces drove the markets. One was a conviction of a dovish pivot that actually factored in late October. The other was the AI enthusiasm that helped propel the “Magnificent Seven” stocks higher, along with the S&P 500. Falling bond rates also helped as they eased valuation headwinds. It was also a signal that Fed rate hikes were likely ending.
As we begin 2024, however, momentum driven markets generally need a level of confirmation to support higher multiples. The next few months will be key as we begin seeing Q4 earnings releases and company forecasts into the 2024 market environment.
I would also expect a continuous shift from the more expensive mega-caps and toward those market sectors, stocks and strategies that missed most of the “Magnificent Seven” rally. Assuming rates actually begin their decline and the economy avoids a hard economic landing, financial stocks should fare well, as will a number of the consumer discretionary categories. Another potentially interesting area is small-cap companies.
Looking back at the last small-cap peak that occurred on November 15, 2022, and performances through this past Friday, the Russell 2000 (IWM) delivered a nominal 2.60% return. Conversely, the S&P 500 was up 21.25%, while the Nasdaq was up 34.80%. These small company stocks are extremely sensitive to both interest rates and economic stability, which proved to be a headwind for the sector in the post-pandemic era. Assuming we are moving into a more stable economic environment, this tends to be favorable for smaller company stocks.
As highlighted on the accompanying chart, over the past 24 years, smaller-cap companies have traded over a premium to the S&P, up 309% over the benchmark. The chart also highlights the difficult times for small-cap companies that occur during recessions, rising rates, and inflation—three scenarios the markets are beginning to discount.

Closing Thoughts
Despite mainstream forecasts, the U.S. avoided a recession in 2023, even with a number of hurdles throughout the year, including impacts from the Fed’s aggressive rate hiking policies. In spite of the banking crises and global conflict, the domestic economy remained resilient while the financial markets continued to grind forward. Although inflation was the key concern last year, this year’s focus is likely to be whether or not the expansion is sustainable.
So far, the economy appears to be on track to sidestep a once feared hard economic landing. GDP growth was solid in Q3 last year, with a reported annualized growth rate of 4.9%. This final quarter of 2023 is on track to deliver an annualized 2.4% growth rate, at least according to the last Atlanta Fed GDPNow model. Taking into account two headline variables, retail sales and unemployment growth, there is diminishing concern for an unexpected economic downturn.
There are concerns, though, that the most watched inverted yield curves remain inverted, and as headlines have reminded us, recessions are generally preceded by yield curve inversions (shorter-term Treasury maturities are yielding more than the longer-term maturities). Interest rates are still high and, in many cases, still restrictive. Other considerations include:
- The ISM Manufacturing PMI survey has been in contraction territory (below 50) for 12 straight months. And in most cases, a double-digit contraction reading has coincided with a recession.
- While housing prices have remained elevated, housing starts have not. Following the peak in April 2022, the rolling 12-month average for housing starts has declined 12 out of the past 16 months. In many cases, this trend has been a recession indicator.

- Although the S&P isn’t cheap, the largest stocks in the index have really skewed market multiples. The S&P 493 stocks (ex-the “Magnificent Seven”) are more reasonably priced, and company stocks categorized in the value, income or small-cap camp are generally undervalued.
- Although the ISM Manufacturing report has been contracting for about a year now, the Services PMI was in expansion territory all last year (above a reading of 50), and the composite PMI (weighted average of manufacturing and services) has remained above 50 since February last year. These indicators point to economic growth versus contraction.
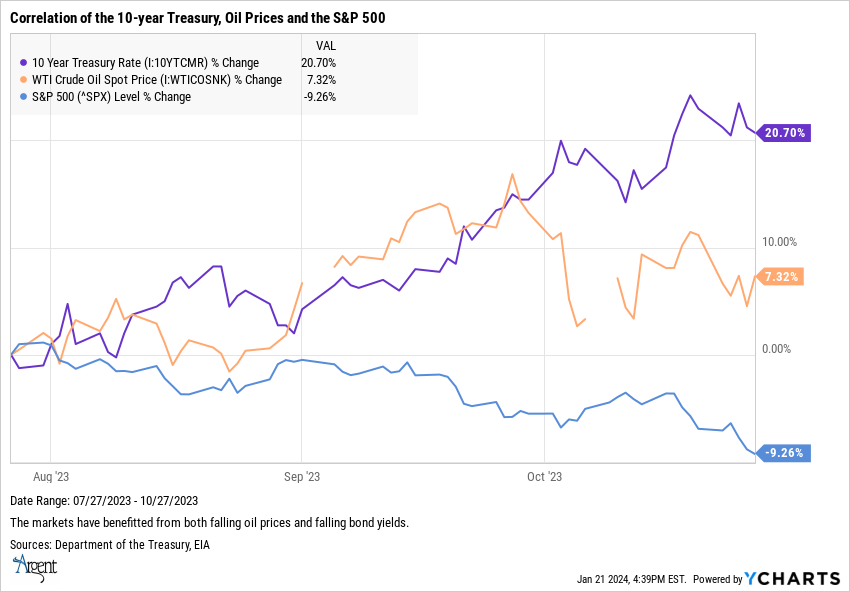
- The broad markets have generally traded inversely to both crude oil prices and bond yields. This was evident in 2023 from July 27 to October 28. The S&P 500 was down nearly 10%, offset by the 10-year Treasury bond, which gained nearly 21%, and West Texas crude up 7%. Conversely, from October 30 to the present, the 10-year Treasury bond dropped in valuation by 15% and oil by 13%, while the S&P recovered by 16%. Although volatile, trends in both oil prices and bond yields now appear to be more market accommodating.
- Finally, we turn to the bond markets for some evidence of a longer-term cyclical signal. Credit spreads are a tool (difference between “riskier” corporate bonds and “riskless” Treasury bonds) used to measure shifting market sentiment (risk-on/risk-off). As the spread (or indicator) rises, it usually precedes a negative shift in the markets, including equities. This was certainly the case during the pandemic era and later in 2022—neither timeframe was conducive to the equity markets. Today, credit spreads are not showing any signs of concern from investors, which supports the case for the continued potential of a “risk-on” rally.

Not Investment Advice or an Offer -This information is intended to assist investors. The information does not constitute investment advice or an offer to invest or to provide management services. It is not our intention to state, indicate, or imply in any manner that current or past results are indicative of future results or expectations. As with all investments, there are associated risks and you could lose money investing.

