


BY: Tom Stringfellow, CFA®, CPA®, CFP®
Chief Investment Strategist
March Madness: War, Inflation, and a Market Repricing in Real Time
Key Themes This Month
- Escalation in Iran has reintroduced energy-driven inflation risk, with oil once again dictating the macro narrative
- Markets are no longer moving together, and dispersion across sectors, asset classes, and regions has widened materially
- Consumer sentiment is weakening, but labor-market stability is still delaying a more visible slowdown in spending
- Credit markets are beginning to show early-stage stress, particularly in lower-quality segments and parts of private credit
- The AI cycle remains fundamentally sound, but valuation sensitivity is rising as rates stay higher for longer
- In this environment, diversification, balance-sheet strength, and earnings visibility matter more than conviction alone
Energy Shock: Repricing the Macro Landscape
Markets entered March with a level of stability that, in hindsight, proved fragile. That stability has since given way to a far more complex environment, driven primarily by the escalation in Iran and its implications for global energy markets. The significance here is not political—it is economic. The Strait of Hormuz facilitates roughly 20% of global oil supply, making it one of the most critical chokepoints in the global economy. Any disruption, or even a credible threat of disruption, forces markets to reassess energy prices, inflation expectations, central bank policy, and ultimately the trajectory of growth.
That shift is already visible in expectations. The University of Michigan’s final March survey showed consumer sentiment falling to 53.3, down from 56.6 in February and marking a 6% monthly decline and a 6.5% drop from a year ago. The deterioration was broad-based, with the expectations component falling nearly 9% for the month, reflecting growing concern around the near-term economic outlook as energy prices and market volatility increased in the wake of the Iran conflict.
Short-Term Shock, Long-Term Anchoring
Inflation expectations moved accordingly. One-year expectations rose from 3.4% in February to 3.8% in March, the largest monthly increase since April of last year and a level now well above the pre-pandemic range. Importantly, however, longer-term expectations moved in the opposite direction. Five-year inflation expectations posted a 3.2% growth rate, remaining within a relatively stable range.
The timing of the survey is worth noting. Nearly two-thirds of responses were collected after the escalation in Iran, suggesting that the rise in short-term inflation expectations is directly tied to the sharp move in energy prices. As of March 30, oil prices remain elevated relative to earlier in the quarter, reinforcing the near-term inflation impulse already reflected in consumer expectations.
What this tells us is that consumers are reacting to immediate price pressures—primarily gasoline—but have not yet adjusted their longer-term view of inflation. In prior inflationary regimes, particularly during the 1970s, short-term and long-term expectations tended to rise together, signaling a loss of confidence in monetary policy. We are not seeing that dynamic today.
If anything, the current environment more closely resembles the period during the 1990 Gulf War, where a temporary oil shock drove a sharp rise in short-term inflation expectations without altering the longer-term outlook. That ultimately proved to be a transitory inflation impulse rather than the beginning of a sustained inflation cycle.
From a policy standpoint, this distinction matters. As long as longer-term expectations remain anchored, the Federal Reserve retains credibility and flexibility. This reduces the risk of a policy overreaction, even as near-term inflation pressures remain elevated and increasingly tied to energy market dynamics.
Breakdown in Traditional Diversification
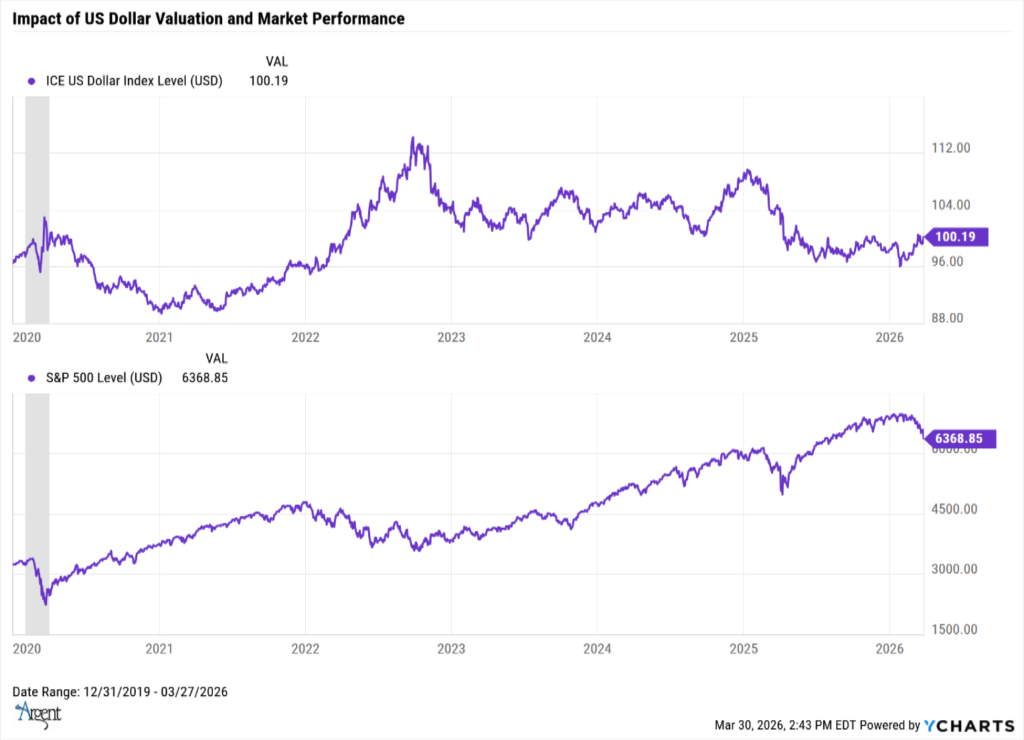
At the same time, one of the defining features of this month has been the breakdown in traditional diversification. Equity markets have moved lower, with the S&P 500 now down nearly 8% from its early-January highs and the Nasdaq down more than 10% over the same timeframe. Historically, that type of equity weakness would be offset by strength in bonds or gold. Instead, Treasury yields have moved higher as inflation expectations have been repriced and expectations for rate cuts have been pushed further out. Gold has struggled to gain traction in recent weeks despite geopolitical tension, reflecting the offsetting impact of rising real yields and a stronger U.S. dollar.
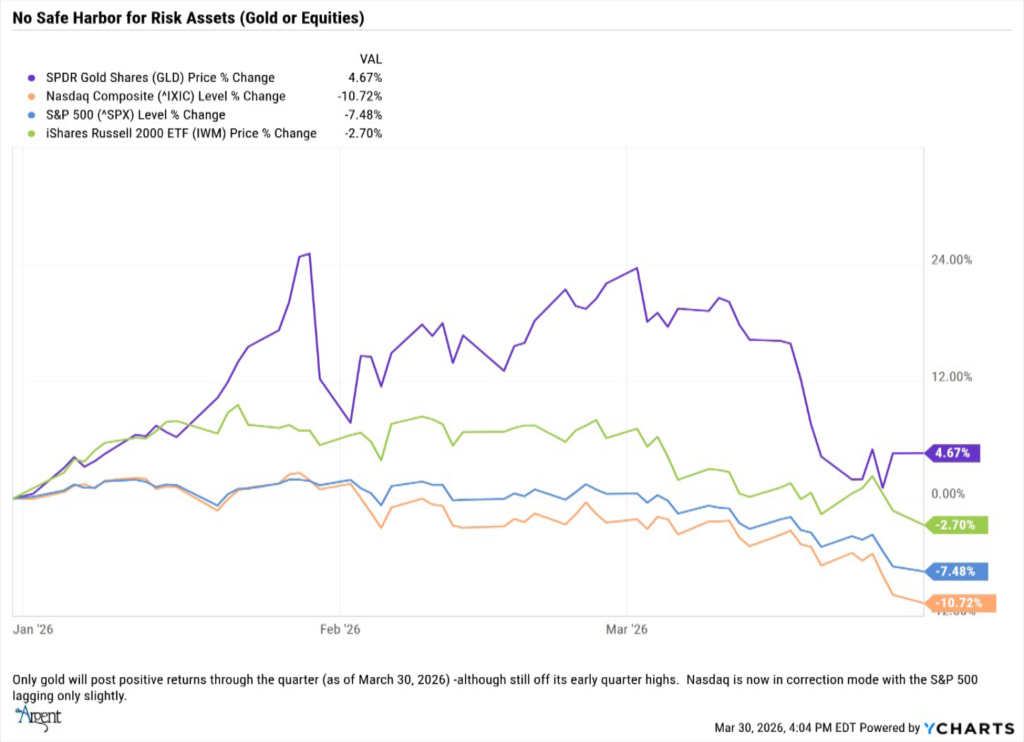
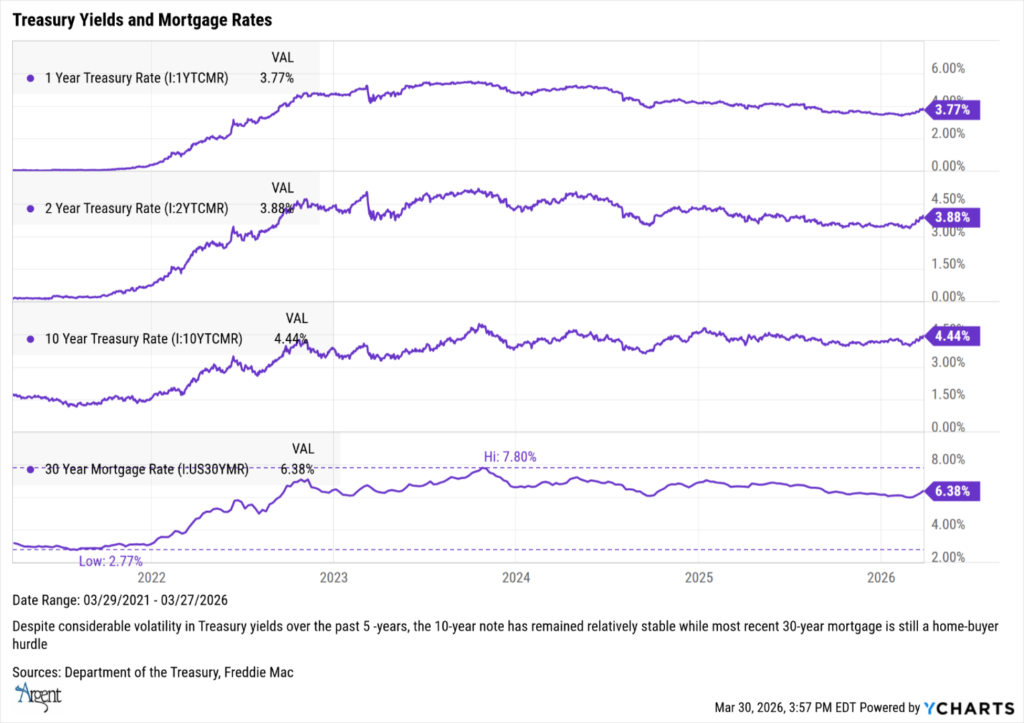
The explanation lies in real rates and currency dynamics. Real yields have risen, and the U.S. dollar has strengthened by roughly 2–3%, increasing the opportunity cost of holding non-yielding assets. The result is a rare environment where stocks, bonds, and gold are all under pressure at the same time, leaving investors with fewer traditional hedges and reinforcing the appeal of short-duration instruments and cash.
Repositioning, Not Retreat
Despite that volatility, capital flows point to repositioning rather than retreat. For the week ending March 25, global equity funds saw inflows of approximately $37.8 billion, the largest weekly inflow in nearly two and a half months. U.S. equities accounted for roughly $37.2 billion, reversing a multi-week outflow trend. Asian markets saw inflows of approximately $5.2 billion, while European funds experienced outflows of roughly $7.5 billion.
Bond fund inflows slowed materially to approximately $2.5 billion, with high-yield credit experiencing outflows of roughly $4.8 billion. In contrast, short-duration bond funds attracted a record $11.1 billion, reflecting a clear shift toward liquidity and lower duration risk. Money market funds saw meaningful outflows after a prolonged period of inflows, suggesting capital is being redeployed, but with far more selectivity.
Sector flows reinforce that point. Financials experienced notable outflows, energy saw modest redemptions despite strong performance, and consumer staples also softened. At the same time, healthcare and selective areas of consumer discretionary attracted inflows, while technology flows stabilized. This is not a market exiting risk—it is a market reallocating based on changing assumptions around growth, inflation, and earnings durability.
The consumer remains central to the outlook, and the data continues to show a divergence between sentiment and behavior. Consumer sentiment declined to 53.3 in March, one of the weakest readings in recent years and down meaningfully from the prior month. The decline has been broad-based, including higher-income households. Despite that deterioration in sentiment, spending has held up. The reason is the labor market.
Resilient but Slowing Consumer Backdrop
The unemployment rate moved modestly higher to 4.4% in February, while nonfarm payrolls declined by 92,000 following a revised gain in January. While some of this reflects temporary disruptions, the broader trend points to moderating hiring momentum rather than outright deterioration. This decline was influenced in part by temporary factors, including strike activity in health care, but the broader trend points to slower hiring momentum.
Wage growth has also moderated, with average hourly earnings rising 3.8% over the past year, a noticeable step down from prior peaks. While jobless claims remain relatively low by historical standards, the combination of softer payroll growth, a modest uptick in unemployment, and easing wage pressures suggests the labor market is no longer tightening but instead moving toward a more balanced, late-cycle footing.
A Constrained Housing Cycle
Housing presents a different type of constraint. Mortgage rates remain in the mid-6% range, well below their peak but still significantly higher than pandemic-era levels. That has created a structural lock-in effect, where homeowners are reluctant to give up historically low financing costs. Inventory remains constrained, existing home sales are down on a year-over-year basis, and price stability is being supported more by limited supply than by strong demand. Housing is not weakening in a traditional sense; it is constrained, and that constraint is limiting one of the economy’s traditional growth channels.
Diverging Economic Signals Beneath the Surface
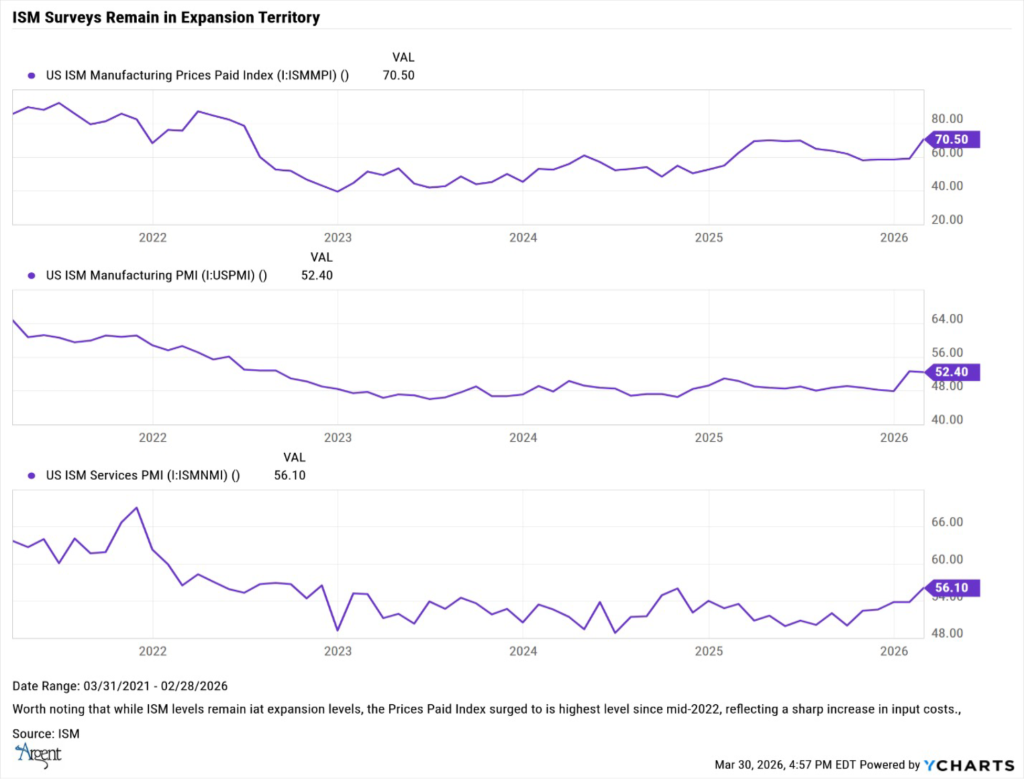
Manufacturing and business activity present a more nuanced picture than the headline suggests. The ISM Manufacturing Index registered 52.4 in February, indicating expansion for the second consecutive month, but the underlying components point to a slowing pace of growth. New orders remained in expansion, near the 56 level, but declined from the prior month, while production also moderated. At the same time, the Prices Paid index surged to 70.5, its highest level since mid-2022, reflecting a sharp increase in input costs tied in part to rising energy prices and broader supply chain pressures.
Labor dynamics within manufacturing also remain soft, with the employment index still below 50, signaling continued contraction in hiring despite improving demand conditions. Backlogs and supplier delivery times have increased, suggesting that while demand has stabilized, capacity constraints and cost pressures are becoming more pronounced.
In contrast, the services sector remains a relative area of strength. The ISM Services Index rose to 56.1 in February, its strongest reading in several months, with business activity and new orders both accelerating meaningfully. Employment within services has also moved back into expansion territory, reflecting continued resilience in the largest segment of the economy.
Taken together, the data points to an economy that is still expanding, but with a growing divergence between sectors. Manufacturing is stabilizing but facing rising cost pressures and uneven momentum, while services activity remains firm. Importantly, the combination of firm demand and rising input costs introduces a more pronounced stagflation undertone—growth is holding, but inflation pressures are re-emerging.
Policy Constraint in a Mixed Growth Environment
This leaves the Federal Reserve in a constrained position. Core inflation remains above target, while energy-driven pressures risk pushing headline inflation higher. At the same time, growth indicators are softening. Recent Fed commentary has emphasized the need for greater confidence that inflation is sustainably moving toward the target before easing policy. Market expectations have adjusted accordingly, with fewer rate cuts now priced in and a later starting point for easing. The Fed is no longer tightening, but it is also not able to ease aggressively. That tension is central to the current environment.
Early Signs of Stress Beneath the Surface
Credit markets are beginning to reflect that shift at the margins. Fund flows confirm a more defensive posture, with outflows from high-yield and increased demand for shorter-duration, higher-quality instruments. High-yield spreads have widened modestly from recent tightening, though they remain below long-term stress thresholds, suggesting early-stage repricing rather than systemic deterioration. The key risk is not immediate impairment, but rather the potential for delayed price discovery in a less liquid structure.
Private credit markets are also drawing increased scrutiny. These markets consist of loans that do not trade publicly and are therefore valued using internal models rather than observable market prices. These are referred to as Level 3 assets—positions whose valuation relies heavily on assumptions rather than transparent pricing. In some funds, these assets represent more than 70% of total holdings. Under normal conditions, that structure functions smoothly. In periods of stress, however, the lack of pricing transparency and limited liquidity can become more meaningful, particularly when redemption pressures increase. These are not immediate risks, but they represent areas where stress could emerge if financial conditions tighten.
“Earnings Strength, Narrowing Leadership
On the earnings front, the broader picture remains intact, but leadership is narrowing and revisions are becoming more selective. FactSet data as of March 27, 2026, indicates that S&P 500 first-quarter earnings are expected to grow approximately 13.0% year-over-year, marking a potential sixth consecutive quarter of double-digit growth. While aggregate growth remains solid, the composition of that growth is increasingly concentrated.
Technology continues to lead, with earnings growth exceeding 40% in some segments, driven by AI-related demand and semiconductor strength, while energy has benefited from higher commodity prices. This leadership remains intact, but is becoming increasingly sensitive to changes in rates, expectations, and positioning. Outside of those areas, revisions have been more mixed to negative, particularly across health care, consumer discretionary, and consumer staples, where demand is moderating and cost pressures are building.
Margin expansion is also showing signs of plateauing. S&P 500 net profit margins are holding near 13%, suggesting that the period of broad-based margin expansion has largely run its course as input costs rise and pricing power becomes more constrained.
Separately, bottom-up analyst price targets compiled by FactSet imply approximately 29% upside for the S&P 500 over the next 12 months based on aggregated company-level estimates. However, the dispersion in those estimates has widened, reinforcing that while the aggregate outlook remains constructive, confidence in the path forward is far less uniform.
Six Years Later: A Narrow Market Foundation
Six years removed from March 23, 2020, COVID market bottom, the longer-term context remains instructive. The S&P 500 more than doubled off those lows at its peak in early 2025, though current levels reflect some retracement amid recent volatility. The result is a market that appears resilient at the surface, but increasingly dependent on a narrow leadership cohort.
From March 23, 2020, through March 30, 2026, the S&P 500 delivered cumulative gains of roughly +183% over the period, while the Nasdaq 100 has advanced closer to +203%. In contrast, small-cap equities have risen approximately +140%, while international markets have trailed further, reflecting weaker growth and currency pressures.
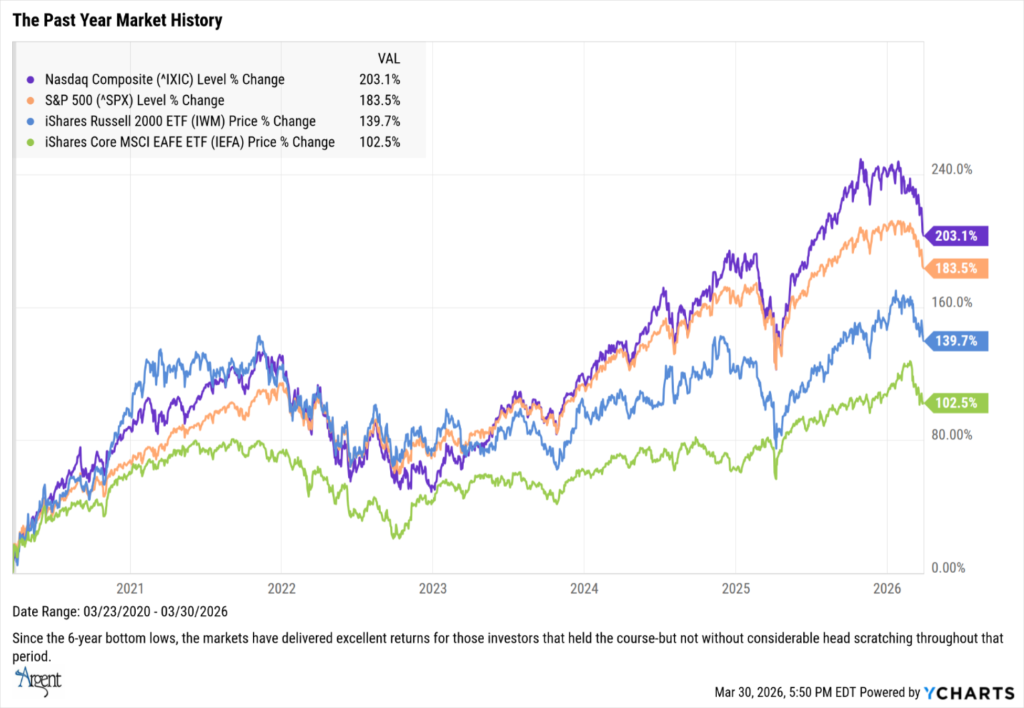
The result is a market that appears strong at the index level but is far less balanced beneath the surface. A relatively small group of companies has accounted for a disproportionate share of total returns, leaving the market more sensitive to shifts in leadership and macro conditions.
Dollar Strength and Global Implications
The U.S. dollar has strengthened modestly in this environment, supported by higher relative interest rates and safe-haven demand. A stronger dollar tightens global financial conditions, particularly for emerging markets, while also influencing trade dynamics and moderating import-driven inflation.
Positioning in a Repricing Environment
What all of this means from an investment standpoint is less about making bold directional calls and more about maintaining balance and discipline. Diversification matters again. Balance sheet strength, free cash flow, and earnings visibility are becoming more important than narrative. Inflation-sensitive sectors have benefited, while rate-sensitive areas have faced pressure. This is not a call to abandon growth, but rather a recognition that valuation and macro sensitivity matter more in this phase of the cycle.
This is not a market that is breaking —it is a market adjusting. Energy has reasserted itself as a key driver of inflation expectations, the Federal Reserve is operating under tighter constraints, and leadership is narrowing. At the same time, the labor market remains stable, consumer spending has not collapsed, and corporate balance sheets remain generally sound.
The path forward will depend on whether energy prices stabilize, whether inflation expectations remain anchored, whether labor market resilience holds, and whether credit conditions remain orderly. Markets are repricing risk in real time, and in that environment, discipline, diversification, and selectivity matter more than conviction alone.
In terms of equity market valuations, it is worth noting that the forward 12-month P/E ratio now stands at 19.9, in line with the five-year average but slightly above the longer-term ten-year average. In contrast, today’s valuation is below the forward 12-month P/E ratio of 22.0 recorded at the end of the fourth quarter last year. Over that time frame, the price of the index has decreased by 3.7%, while the forward 12-month EPS estimate has increased by 6.6%. Valuations are becoming more reasonable, which is beginning to set the stage for investor interest once again.
Not Investment Advice or an Offer -This information is intended to assist investors. The information does not constitute investment advice or an offer to invest or to provide management services. It is not our intention to state, indicate, or imply in any manner that current or past results are indicative of future results or expectations. As with all investments, there are associated risks and you could lose money investing.


