


BY: Tom Stringfellow, CFA®, CPA®, CFP®
Chief Investment Strategist
Reading the Pullback: What Matters, What Doesn’t
Data Through November 20, 2025
Opening Observations
- November has produced some of the sharpest mid-month reversals we’ve seen in years, with multiple high-beta and speculative groups swinging several percentage points at a time as volatility has trended higher.
- Despite strong earnings and improving guidance, investor sentiment has weakened noticeably, creating a gap between market behavior and what the underlying data suggests.
- Economic indicators remain mixed but not recessionary — payrolls surprised on the upside while unemployment has drifted higher, signaling a modest cooling rather than a downturn.
- The Federal Reserve is entering year-end more divided than at any point since 2019, increasing uncertainty around December’s rate decision and the broader policy direction heading into 2026.
- Credit markets are flashing early signs of caution as spreads widen in AI infrastructure and cloud-related issuers — a notable tone shift from the first half of the year.
November That Doesn’t Feel Like November
November is historically one of the most reliable months for equities. This year has been anything but typical. Instead of the steady seasonal lift investors expect, markets have experienced a frustrating pattern of rallies and sell-offs that rarely match the tone of the incoming data.
Part of this disconnect lies in market leadership. Only one of the so-called Magnificent 7 stocks is positive this month — Alphabet. The remaining six stocks are in negative territory, ranging from -2% (Apple) to -13% (Tesla). In contrast, the equal-weight S&P 500 (RSP), while negative for the month through November 20 (-3%), has meaningfully outperformed the large-cap benchmarks. That inversion — where the average stock outperforms the giants — signals a shift in market psychology.
Sentiment readings offer a similar split. Professional managers remain fully invested, but retail sentiment has softened, creating opposing interpretations of the same data. Retail investors see rising unemployment, rising volatility, and conflicting Fed messaging. Institutional investors see resilient earnings, stable consumption, and improving guidance. The result is a tug-of-war between cautious flows and committed positioning.
Compared to last year, the picture is even more interesting. In mid-November 2024, the Nasdaq 100 was up roughly 24% year-to-date on the back of the AI surge and expectations of rapid Fed easing. Today, the Nasdaq is up about 14% year-to-date — strong, but a far cry from last year’s pace. The S&P 500 is up around 11% year-to-date, slightly behind mid-November 2024. Small caps have also fallen behind this year, up 3.7% through November 20, 2025, compared with 15% this time last year.
Economic data mirrors this duality. ISM Manufacturing remains in mild contraction with an index reading of 48.7 but is modestly better than last November’s 46.5. ISM Services is faring better than manufacturing index, sitting in the low fifties, but still slightly behind last year in both cases. The measures are, however, still in expansion territory. The Leading Economic Index continues to drift lower year-over-year, and at a faster decline than in the first half of 2025. Importantly, none of these indicators alone suggest recession, but they do reflect a maturing cycle fighting through the last mile of inflation normalization.
Under the surface, volatility has formed a clear uptrend. Several high-beta baskets have posted multiple 3% declines in just two weeks — something rarely seen outside of 2020–2022. This pattern contributes to the uneasy feeling that the market has become harder to “trust,” even as fundamentals remain steady. It is a market that is not breaking down but is certainly not gliding higher in the familiar November pattern.
Why Volatility Feels Different Now
Today’s volatility is less about economic shocks and more about the structure of the market itself. The sensation of sudden, exaggerated moves does not come from new information — it comes from how the market processes information.
Several forces contribute to this dynamic.
Passive flows play a larger role than ever before. With more than half of U.S. equity fund assets in passive vehicles, large-cap stocks move mechanically as money enters or leaves the system. These flows do not evaluate fundamentals; they simply adjust weights, amplifying trends rather than smoothing them.
Market liquidity adds another layer. Most investors only see Level 1 data — the best bid, best ask, and the last trade. Level 2 data reveal how little support sits just below the surface, while Level 3 depth, visible only to market makers, shows how quickly that support can evaporate under pressure. Liquidity looks deep until it is needed, and then it often is not there.
Dealer hedging further complicates the picture. Options dealers continuously hedge the delta and gamma exposures on their books. When markets rise, they may have to buy; when markets fall, they may have to sell. This mechanical behavior can turn a modest move into a sharper one simply because positioning requires it.
Volatility-targeting funds and risk-parity models add to the chain reaction. These strategies reduce exposure as volatility rises. Even a mild uptick can cause these models to shed equities or leverage, adding more selling into a market that was only drifting lower to begin with.
Trend-following and other systematic strategies then reinforce whatever direction is underway. These programs respond to the direction of price, not the reason for the move. Once a trend begins, these systems lean into it, extending both rallies and sell-offs.
Together, these layers create conditions in which the “meaning” of a move becomes less important than the fact that the move happened. A small spark — such as a one-tenth miss on a minor data point — can trigger a mechanical response that overwhelms fundamentals.
A quick example illustrates the point. Earlier this month, the S&P 500 opened roughly flat after a quiet economic report. Under the surface, however, options dealers were net short gamma, meaning they needed to hedge intraday swings. When the index drifted lower by just a quarter of a percent, those hedges required selling. That selling widened spreads in an already thin order book. As those spreads widened, volatility ticked higher, forcing a set of volatility-targeting funds to cut exposure. The resulting flows pushed the index down another 1%, at which point short-term trend systems flipped negative and added to the pressure. By midday, what began as an essentially meaningless data point had turned into a sharp, hollow move that felt far more consequential than it actually was. The economic backdrop did not change — the mechanics simply took over.
This framework helps explain why November’s volatility feels out of character. The fundamentals are not deteriorating; the structure is simply more sensitive to shallow liquidity, hedging flows, and systematic reactions — and these forces tend to reveal themselves quickly and without warning.
AI: From Euphoria to Skepticism
The transition from AI euphoria to AI skepticism has been one of the defining developments of the past two months. For much of the past two years, markets eagerly rewarded every new announcement of data-center expansions and multibillion-dollar GPU purchases. Recently, investors have begun asking more grounded questions about end-user adoption, monetization, and returns on investment.
A key source of concern is the circular nature of some AI funding. Large technology companies provide capital to AI startups, which then use those funds to purchase compute and cloud capacity from the same large technology companies. While this structure is not inherently problematic, it does raise questions about sustainable demand when so much spending originates within the ecosystem itself.
Credit markets have already picked up on these risks. Several AI-related credit spreads have widened, indicating that lenders are demanding more compensation for potential downside. These moves are often early signals that enthusiasm is tempering.
The broader equity market response has been uneven. Earnings season was undeniably strong — more than 80% of reporting companies beat both earnings and revenue expectations. Guidance rose at high rates. Yet the AI baskets have struggled, particularly the speculative and implementation-focused names. Infrastructure has held up comparatively well, but even there the momentum has cooled down.
This divergence suggests investors are moving past the headline phase of the AI story. Nvidia’s late-November earnings now serve as a key litmus test. A strong but realistic outlook — one grounded in end-user demand rather than purely CapEx narratives — would help reestablish confidence. An overly exuberant or overly cautious message risks reinforcing the skepticism building beneath the surface.
The Pullback: Key Forces Behind the Market’s Repricing
This month’s pullback feels different because it reflects a repricing of expectations rather than a deterioration of fundamentals. Three themes have dominated: the reassessment of AI, a more fractured Federal Reserve, and the interplay between resilient earnings and weakening sentiment.
The reassessment of AI has already weighed heavily on the market’s largest companies. Investors are no longer satisfied with headline-driven enthusiasm; they want evidence of durable demand beyond hyperscalers. Any sign that the return on AI investment is decelerating or that hyperscalers are reevaluating their timelines would deepen the pullback.
Fed dynamics have played an equally important role. Rate cuts that once appeared certain now look conditional. Market-implied odds of a December cut have dropped sharply, and investors are increasingly focused on the broader trajectory of policy into 2026. A divided Fed, particularly at this point in the cycle, increases uncertainty around valuations and heightens sensitivity to incoming data.
At the same time, earnings have not broken down. In fact, this has been one of the strongest reporting seasons in years. Yet stocks have reacted modestly or even negatively to good results. This disconnect underscores the gap between fundamentals and sentiment — one of the defining features of the current environment.
If AI demand stabilizes, if labor market data confirm steadiness rather than deterioration, and if the Fed signals commitment to easing in 2026, the pullback should remain shallow. If any of these themes worsen, the adjustment could continue through year-end.
Labor Market: Cooling, Not Cracking
The delayed September payrolls report came with a headline that was far stronger than expected: 119,000 new jobs compared with expectations of roughly half that amount. Gains were concentrated in the service sectors — leisure and hospitality, and private education and health services — while transportation and warehousing continued to weaken.
Yet beneath the surface, the narrative is more complicated. August was revised down to a slight contraction, and earlier months now appear softer than initially reported. These revisions suggest the labor market may have experienced a mild slowdown during the summer months — one that became visible only after the government shutdown delayed the data.
Unemployment rose to 4.4%, the highest level since late 2021, while the labor force participation rate ticked up to 62.4%. Average hourly earnings increased 0.2% for the month and 3.8% year-over-year. Both measures are slightly below last year’s pace.
Jobless claims reinforce this mixed picture. Initial claims remain healthy at around 220,000, consistent with long-term averages. Continuing claims, however, have risen to nearly 1.957 million — the highest since 2021. This implies that while layoffs are limited, displaced workers are taking longer to find new employment.
Compared to a year ago, the labor market has cooled but not cracked. Unemployment is nearly a percentage point higher, wage growth has slowed, and participation has improved modestly. The overall picture is one of a labor market transitioning from the post-pandemic surge to a more sustainable pace — a natural evolution rather than a sign of danger.
Inflation and Goods Pricing: Sorting Fact from Fiction
Inflation remains one of the most debated topics heading into year-end, especially with recent viral charts suggesting dramatic increases in categories like apparel and furniture. When you break down the verified data, the picture looks more measured and considerably more nuanced.
Apparel excluding footwear has risen only modestly this year — nowhere near the 10% figures circulating online. The broader household furnishings and operations category has also experienced firmer pricing over the past several years, but again not at a pace approaching double-digit annual inflation. Much of the pressure in these categories reflects the cumulative effect of tariffs, transportation costs, and higher input prices across global supply chains rather than a sudden spike in 2025. Furniture, appliances, textiles, and select home-goods categories have seen incremental increases as companies adjust to the cost structure tied to recent tariff policy changes, but these gains have been measured rather than dramatic.
The most recent official inflation data available is from September, released in mid-October due to the shutdown. At that point, headline CPI was running slightly above where it stood last fall, reflecting year-over-year moderation in energy and goods prices. Core CPI was essentially unchanged from late 2024 levels, supported by continued strength in shelter and labor-intensive services. Durable goods continued to exhibit mild deflation after several years of elevated demand, while food-at-home inflation remained stable and considerably lower than the pace seen during the 2021–2023 period.
Where tariffs have taken effect — especially in categories such as select apparel items, furniture components, and certain household durable goods — we are beginning to see isolated price increases. But these increases are specific to tariff-heavy segments and do not reflect a broad-based acceleration in inflation. With no October or November CPI data available yet, the most accurate interpretation is that inflation remains uneven and category-specific, not re-accelerating in aggregate.
The Federal Reserve: A House Divided
One of the more significant developments this fall has been the reemergence of policy disagreement within the Federal Reserve. The October FOMC minutes revealed a degree of division we haven’t seen since the run-up to the “insurance cuts” of 2019. Many participants favored cutting rates in October, several were firmly opposed, and some expressed uncertainty, resulting in a rare acknowledgment of “strongly differing views” on the path ahead.
That division has become more visible as Fed Governors and regional Presidents take to the speaking circuit. Just a few weeks ago, markets were broadly expecting a December rate cut. By mid-November, those expectations had weakened substantially. Market-implied odds of a December cut fell sharply — from the high-seventies to low-nineties percent range in early October to roughly forty-to-fifty percent (and at times lower) by mid-November, depending on the futures measure used. The shift reflects not a collapse in the underlying data, but a growing disagreement within the Fed about how to interpret the mixed signals coming from the labor market, inflation moderation, and the impact of tariffs on overall price dynamics.
Mary Daly, typically viewed as a centrist within the Committee, offered perhaps the clearest indication of how sentiment has shifted. Earlier this year she leaned dovish in support of the labor market, but her recent comments emphasized a more cautious tone and an “open mind” toward the next policy step rather than explicit support for easing. Meanwhile, long-standing doves at the Board — including Waller and Bowman — continue to emphasize the need to support the labor market should softening trends become more pronounced.
This division matters because it increases market sensitivity to each incoming data release — especially after the government shutdown delayed key reports such as CPI, retail spending, and the household employment survey. With several major datasets still incomplete, investors are navigating a patchwork of partial information, which makes it more difficult to anchor expectations. The result has been modest upward pressure on real yields, a firmer dollar, and a valuation headwind for long-duration assets.
As the Fed approaches its final meeting of the year, the practical question is less whether the cut happens in December or January, and more whether the overall rate path for 2026 remains intact. Investors will be watching closely to see which camp gains influence — those who prefer to hold rates steady until inflation moves decisively lower, or those concerned that the labor market may be cooling faster than headline numbers suggest.
Market Structure, Liquidity, and Sector Performance
Market structure has had an outsized influence on the character of November’s volatility. It isn’t that the economic news has deteriorated meaningfully — it’s that the mechanisms behind price formation have become more fragile. Thin liquidity, the dominance of passive flows, and leverage-sensitive positioning have all combined to create an environment where moves happen faster and stretch further than fundamentals alone would justify.
Liquidity across the equity market continues to thin as assets migrate into passive strategies. When liquidity is shallow, routine selling can produce outsized price impact. Market depth simply does not resemble the landscape of ten or fifteen years ago. Small pockets of selling often trigger dealer hedging, which reinforces the move and creates feedback loops. Add volatility-targeting strategies that reduce exposure when volatility rises, plus trend-following systematic models that amplify directional moves, and you have the kind of rapid intraday reversals we’ve seen throughout November.
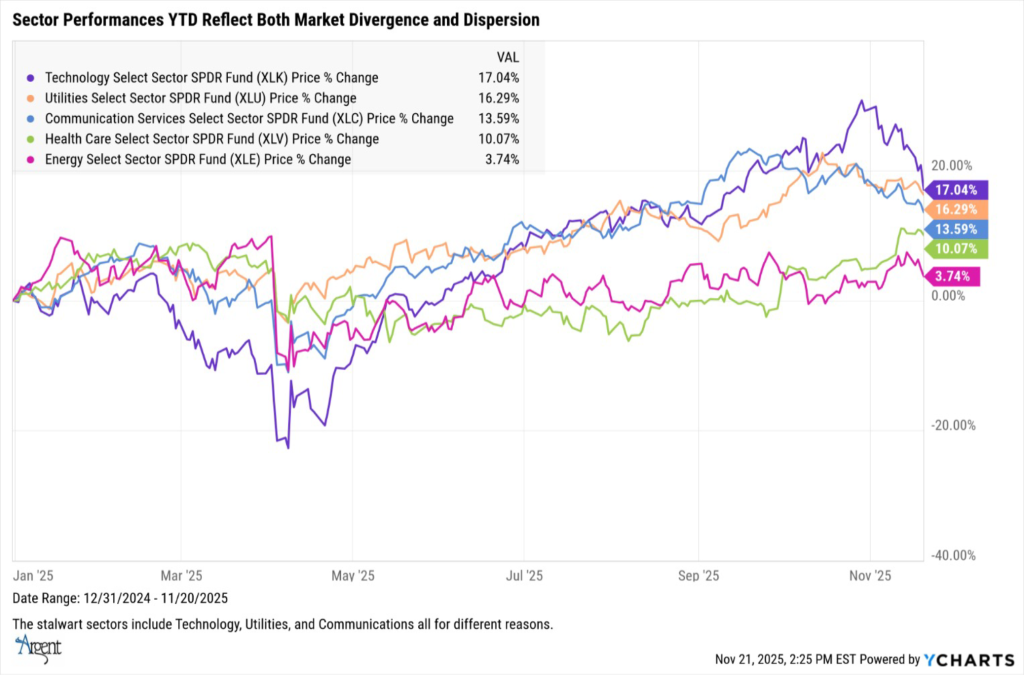
Against that backdrop, sector performance reflects a clear rotation. Technology — still one of the best-performing sectors year-to-date, through November 20, 2025, with a gain of 17.04%, has sharply underperformed in November. Communication Services, up 13.59% for the year, has also struggled. Meanwhile, health care, one of the lagging market performers, is up 10.07% year-to-date. Utilities have been another standout, up 16.29% through November 20, capturing flows from investors seeking stability in the face of rising volatility. The broader equity indexes underline the same story. The S&P 500 total return is up 12.45% through November 20, one-half of the index’s full 2024 return.
Performance outside the U.S. tells an even more diversified story. Several major international markets have outpaced U.S. large caps by a wide margin. Spain (EWP) is up 60.77% on a total return through November 20. Brazil (EWZ) is likewise up 44.29%, and Italy (EWI) is up 43.71%. Germany’s market (EWG) has climbed 24.22%, Japan (EWJ) is up 24.24% and Mexico (EWW) is up 43.56%. Emerging markets as a group have returned over 28%, comfortably ahead of the S&P 500.
Despite a firm dollar, which remains below its late-2024 highs, global capital flows have stayed relatively stable, and non-U.S. market performance suggests that leadership is broadening geographically — not just within sectors.
Taken together, this combination of structural fragility, sector rotation, and wide performance dispersion underscores the need for selectivity. Investors benefit from leaning toward areas supported by real demand, durable cash flow, and long-cycle investment trends — and being cautious in segments that depend heavily on abundant liquidity or speculative momentum.
Positioning Heading into Year-End
Given the backdrop of shifting leadership, increased volatility, and mixed data, positioning should be grounded in durability and visibility. Areas tied directly to long-cycle investment themes — such as power generation, transmission, and energy infrastructure — remain well supported. These businesses benefit from multi-year commitments to electrification, data center expansion, and industrial reshoring. Their revenue streams tend to be consistent, offering stability in uncertain environments.
Critical minerals and metals tied to the hard-asset ecosystem also warrant attention. Global demand for copper, lithium, and specialized materials remains elevated, reflecting long-term shifts in power infrastructure, transportation, and advanced manufacturing. These sectors are less dependent on short-term consumer behavior and more aligned with structural investment trends.
Health care continues to recover from a prolonged slump, driven by both defensive positioning and better-than-expected fundamentals. Managed care faces policy uncertainties, but broader health care enterprises offer pricing power and relatively predictable demand. From an investor perspective, health care today is trading at significant P/E multiple discounts to the S&P 500 of roughly 20-30% valuations levels that generally offer great opportunities for long-term investors.
In technology, companies with clear revenue visibility and diversified demand outlooks are better positioned than speculative AI names. Investors are rewarding firms that can demonstrate real customer adoption rather than relying solely on CapEx-driven enthusiasm.
Areas to approach cautiously include high-beta growth stocks, unprofitable technology, and overstretched AI beneficiaries without strong end-user traction. Tariff-sensitive consumer goods categories may struggle with cost increases, and deep cyclicals with margin pressure remain vulnerable if economic data softens further. These are the pockets of the market most likely to underperform if volatility persists.
In short, investors should prioritize balance sheet strength, cash flow consistency, and real demand visibility. The market is increasingly distinguishing between companies that can navigate the crosscurrents and those overly reliant on favorable liquidity dynamics.
Closing View: Staying Grounded in a Fast-Moving Global Environment
As we move into the final weeks of the year, the global economic landscape remains mixed but generally more stable than it appeared six months ago. A number of central banks, including those in Canada, Brazil, Chile, and South Korea, have either begun cutting rates or are signaling an openness to doing so. Europe is experiencing continued disinflation, and several economies are beginning to see modest improvements in consumption and industrial activity. In contrast, China’s economy faces persistent challenges, from weakening property markets to slowing investment and consumer spending.
These global dynamics matter because they shape capital flows, affect commodity prices, and contribute to the relative performance of international markets. Despite the headwinds in China, several global markets have significantly outperformed the United States this year, reflecting both country-specific catalysts and a diversification of leadership away from the U.S. mega-cap cohort.
Here at home, the primary drivers of volatility remain the Fed’s internal division, the evolving AI narrative, and a labor market transitioning from rapid recovery to slower, late-cycle normalization. These forces have created an environment where mechanics amplify price movements more than the underlying data may justify.
In fast-moving markets, the key is to stay grounded. The fundamentals are not breaking down, nor are they accelerating dramatically. We are navigating a transition period, similar to others we have seen over the decades, where the market adjusts from one dominant narrative to a more balanced one. Clarity returns more quickly when decisions are anchored in visibility, cash flow, and resilience rather than sentiment or speculation.
Steady positioning, selective risk-taking, and an appreciation for the market’s evolving structure remain essential tools as we move toward year-end and into the early innings of 2026.
Not Investment Advice or an Offer -This information is intended to assist investors. The information does not constitute investment advice or an offer to invest or to provide management services. It is not our intention to state, indicate, or imply in any manner that current or past results are indicative of future results or expectations. As with all investments, there are associated risks and you could lose money investing.


