


BY: Tom Stringfellow, CFA®, CPA®, CFP®
Chief Investment Strategist
Trending Within a Volatile Market
Navigating a Later-Cycle Landscape
- Resilient growth continues despite policy noise and an extended government shutdown.
- The Fed’s late-October meeting and a gradually steepening yield curve confirm a measured easing path.
- Consumers remain active, though credit reliance is increasing; housing, labor, and travel data point to moderation, not weakness.
- Volatility spikes persist, but October’s history of turbulence usually ends with higher markets.
- Structural shortages—from electricity to critical materials—are reshaping investment priorities.
Credit Markets – Stability Amid Pockets of Strain
Early-October disclosures from Zions Bancorp and Western Alliance Bank—about $110 million in combined provisions linked to allegedly fraudulent commercial loans—revived memories of regional bank volatility and pushed the KBW Regional Bank Index down roughly 6 percent for the week. Liquidity and capital ratios remain sound, but confidence is still thin after two years of rate stress and scattered credit headlines.
Private credit has become a central funding channel. According to Morgan Stanley, the asset class totaled roughly $3 trillion at the start of 2025, up from about $2 trillion in 2020, and is projected to approach $5 trillion by 2029. Growth has accelerated as tighter bank lending standards and public market volatility push borrowers toward the price certainty and speed offered by direct lenders. For investors, the takeaway is clear: private credit is now part of the core fixed income universe, offering opportunity but also new concentrations of risk.
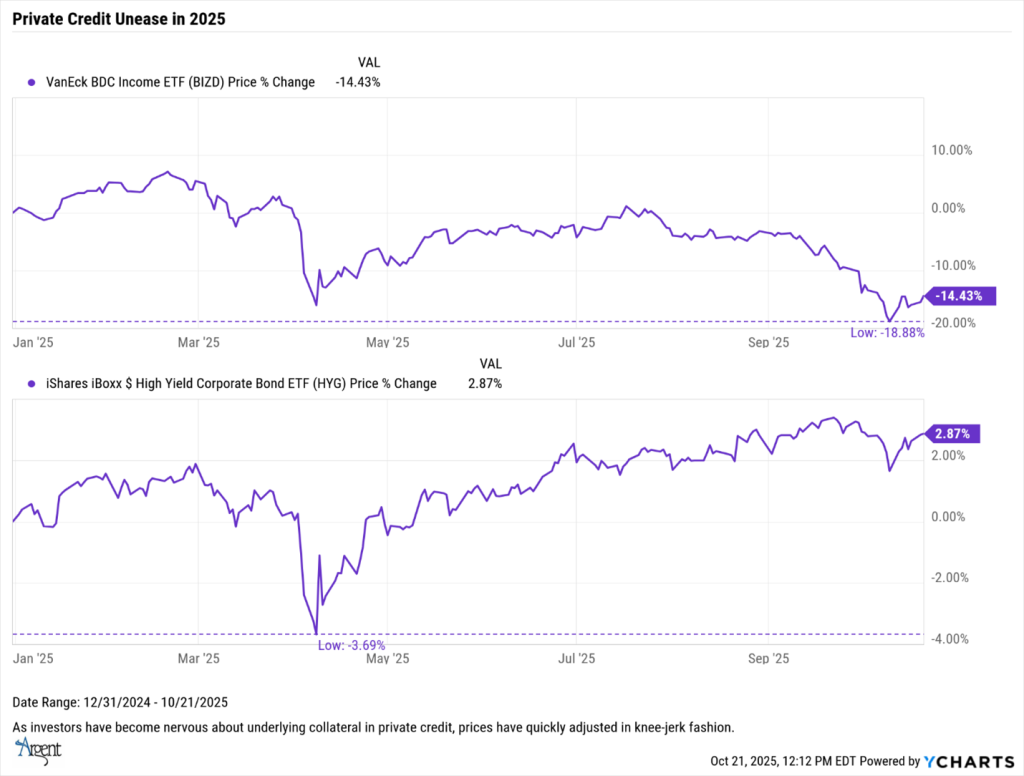
Public proxies such as BIZD (Business Development Company ETF) and HYG (High-Yield Bond ETF) drifted lower into mid-October—more a repricing than a break—while the Moody’s Baa-to-10-Year Treasury spread hovered around 1.71 percentage points, well below levels that signal credit stress. In short, credit conditions are tightening but functioning; liquidity is adjusting, not retreating.
The Economy – Slowing but Not Stalling
The Federal Reserve’s Beige Book, compiled through October 6, depicted an economy transitioning from strong to steady. Three districts reported modest growth, five were unchanged, and four showed slight declines. Mentions of “uncertainty” fell about 20 percent from September as firms adapted to tariffs and supply friction rather than cutting activity. Executives are managing through noise instead of retreating.
The federal government shutdown—now in its third week—has delayed 19 major data releases, including CPI and payrolls, forcing markets to lean on regional and private proxies that still portray a run-warm economy. The frustration is informational, not fundamental: investors dislike flying blind more than they dislike moderate growth.
Scarcity as a Driver of Growth
What distinguishes this cycle is how physical constraints have become the new governors of growth. First came the scramble for electrical power to feed data centers and AI infrastructure; now the bottleneck lies in the materials needed to build them. Rare-earth metals and critical minerals have moved from industrial obscurity to strategic importance. China controls roughly 60 percent of global mining and about 90 percent of processing capacity, turning resource security into a policy priority.
Western governments are responding. U.S. and European programs are funneling capital toward domestic production and recycling while pursuing alliances to diversify supply. Companies such as MP Materials, Lithium Americas, and Critical Metals Corp. stand to benefit. For investors, this emerging “scarcity trade” means structural opportunity in industrials, utilities, and defense names linked to energy transition and grid modernization. The new industrial cycle is being built on constraint as well as innovation.
The Consumer – Thin Cushions, Steady Spending
Households remain the economy’s ballast even as their margins narrow. The New York Fed’s second-quarter report showed total household debt rising $185 billion to $18.39 trillion, with mortgage balances up $131 billion to $12.94 trillion, credit-card balances up$27 billion to $1.21 trillion, and auto loans up$13 billion to $1.66 trillion. Overall delinquencies edged higher to about 3 percent of balances, consistent with late-cycle normalization rather than stress. Mortgage delinquencies hover near 3 percent and credit-card delinquencies around 8 percent of balances that are 30 days past due. Credit use is expanding, but most households continue to manage their obligations.
Housing has flattened but not cracked. The S&P CoreLogic Case-Shiller Index was 326.4 in July—essentially unchanged month to month, while purchase applications fell 1.8 percent in early October with 30-year mortgage rates near 6.3 percent. Builders are using incentives to sustain sales, and demand remains solid in the Sun Belt.
Labor markets are loosening without breaking. The NFIB September survey showed 32 percent of owners with unfilled positions—the lowest since 2020—and 18 percent listing labor quality as their top concern. Wage growth is cooling but positive, a combination that helps both the Fed and households.
Spending data tells the same story: Chicago Fed retail-sales and First Data card indexes each show roughly 4½ percent year-over-year growth through September. Auto sales remain above 16 million SAAR pace. Travel is robust with hotel occupancy near 69 percent and TSA throughput at 2.3–2.6 million travelers a day. Services are carrying expansion even as goods spending levels off.
A Goldman Sachs analysis published this month offered a clearer view of how tariff costs are being absorbed. As of August, U.S. businesses were carrying about 51 percent of the burden, consumers 37 percent, foreign exporters 9 percent, and roughly 3 percent was attributed to tariff-evasion slippage. By the end of 2025, Goldman projects consumers will bear around 55 percent of the cost, businesses 22 percent, foreign exporters 18 percent, and evasion 5 percent. Firms are still digesting new tariffs, but as contracts reset and import prices adjust, the consumer again becomes the end-payer. Near-term pressure sits in corporate margins; longer-term it hits household purchasing power.
Rates and Policy – The Fed’s Balancing Act
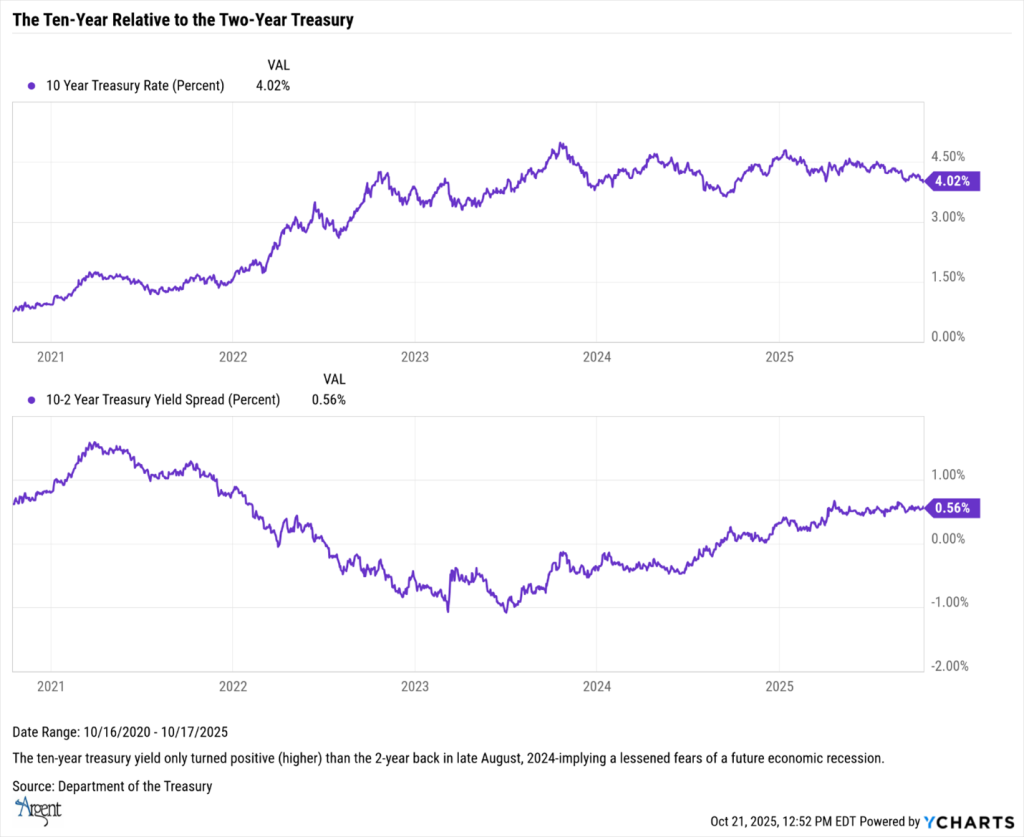
Ten-year Treasury yields closed at 4.02 percent on October 17, while the two-year ended near 3.46 percent, leaving the 2s-10s spread at +0.56 percent. The curve first turned positive in late August 2024 after nearly two years of inversion and has stayed modestly positive since—an indication that markets now expect slower growth rather than outright contraction.
The next FOMC meeting, scheduled for October 28–29, follows one 25-basis-point rate cut in September, with expectations of at least 2 cuts this year. Futures imply another reduction by year-end, and possibly one more in early 2026. The Fed’s September Summary of Economic Projections still paints a soft-landing outlook: 2025 real GDP at 2.1 percent, unemployment at 4.3 percent, core PCE at 2.6 percent, and a long-run funds-rate near 2½ percent. Inflation expectations from the New York Fed’s October 7 survey stand at 3.4 percent one-year ahead and 3.0 percent for both the three- and five-year horizons.
Sentiment remains guarded. The University of Michigan’s preliminary October reading came in at 55.0, and the Conference Board’s September index at 94.2. The Fed’s real trade-weighted dollar index was 114.9 in September—elevated but off its peak—helping contain imported inflation while weighing on exporters.
Corporate Profits – Broad but Tech-Heavy
Earnings season began on an upbeat note. By October 17, about 12 percent of S&P 500 companies had reported results, and 86 percent beat expectations by an average of six percent. The blended earnings-growth rate is running near 8½ percent, with revenues up about 6½ percent. Technology and Financials lead, while Energy and Consumer Staples face tough comparisons. Management tone has shifted from cost control to cautious expansion—an encouraging sign for capital spending and employment.
Large-cap profitability remains exceptional. The biggest U.S. technology and industrial firms are generating returns on equity and margins well above long-term averages, trading at forward price-to-earnings ratios in the mid-20× range and enterprise-value-to-sales ratios near 6×—multiples supported by strong cash flow and market dominance. Ex-tech, aggregate S&P 500 earnings growth drops to roughly three percent, illustrating how dependent the index remains on a handful of high-quality outperformers.
Market Sentiment – Anxiety Without Panic
October again lived up to its reputation for turbulence. The VIX spiked to 25 on October 16 and touched 28 intraday the next day before closing near 21. The VIX/VIX3M ratio—comparing one-month to three-month implied volatility—rose above 1.0, a configuration that typically signals short-term oversold conditions. Despite the swings, the Russell 2000 held above its 2024 high, and breadth improved, showing that investors are hedging risk rather than exiting exposure.
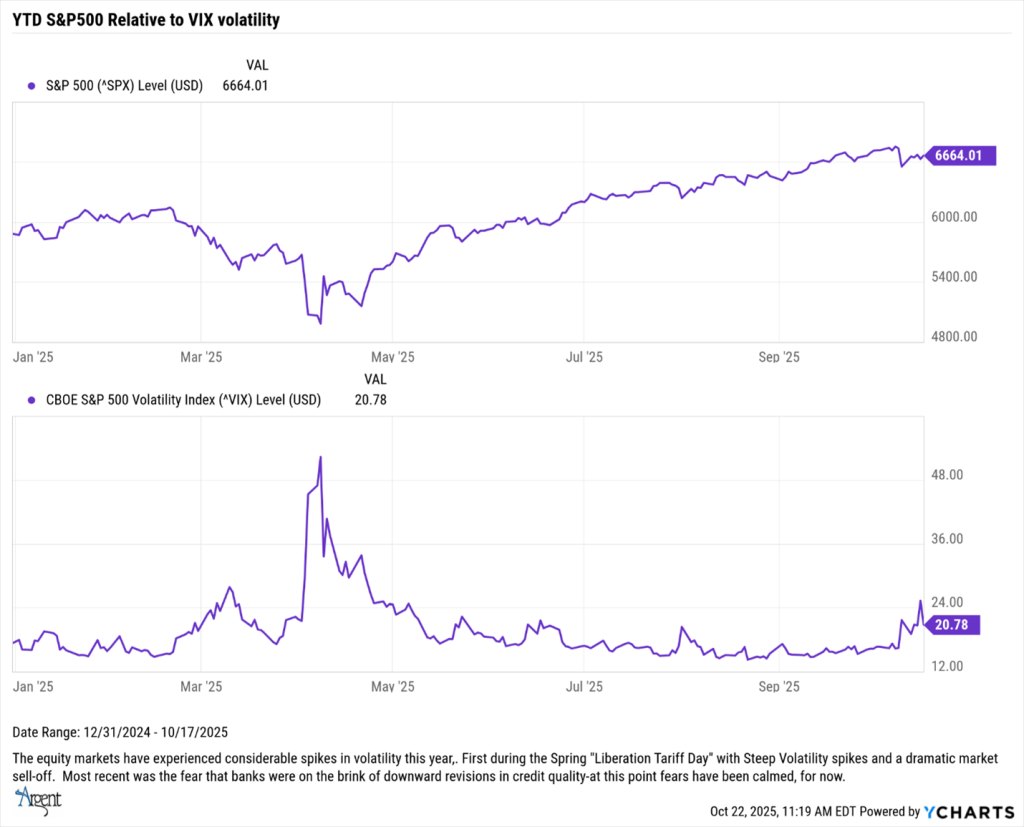
Seasonality favors that stance. Historically, October delivers the sharpest swings but often finishes positive, and early performance trends fit that pattern. Markets are repricing optimism, not reversing classic late-cycle behavior in which leadership rotates while the underlying trend endures.
Commodities and Global Rotation – Anchors of a New Cycle
Precious metals continued to act as the market’s shock absorber into mid-October. Gold traded in a tight band between $4,250 and $4,310 per ounce on October 17, while silver’s year-to-date gains approached 80 percent. Those levels reflect a blend of lower real yields, ongoing geopolitical risk, and the renewed demand for tangible stores of value during data gaps and policy uncertainty. By contrast, West Texas Intermediate crude settled near $57 per barrel as OPEC+ supply and record U.S. production offset headline risks and crack spreads compressed. Industrial metals were mixed and agricultural prices steady, leaving broad commodity indices roughly flat on the week.
That split—firm precious metals against softer energy and flat base metals—captures the market’s barbell. Investors continue to pay up for safety and inflation hedges, but they’re not yet willing to commit new capital to demand-sensitive commodities until global growth data stabilize. The message is not “risk off” so much as “risk selective”: real assets remain in the core allocation but positioning favors hedges and structural themes over cyclical beta.
Global Rotation
Rotation is no longer just a U.S. story. Abroad, leadership is broadening in ways that complement domestic sector moves:
- Japan remains the standout among developed markets. Corporate governance reforms are unlocking balance sheets, buybacks are rising, and a weaker yen continues to lift exporters’ earnings translation. The combination has drawn global capital back to Tokyo and, importantly, the flow has been steady rather than speculative.
- Europe has stabilized at the margin. Manufacturing PMIs appear to be bottoming, energy costs have eased from last year’s extremes, and disinflation has given the ECB room to pause. That cocktail isn’t a boom, but it does support modest earnings improvement and a rotation into quality cyclicals.
- In emerging markets, Brazil and Mexico have benefited from nearshoring and supply chain r-routing to North America. Currency stability and more credible policy frameworks have enhanced those tailwinds. China remains a wild card—property and trade frictions keep volatility elevated—but targeted stimulus has at least reduced downside tail risk.
At home, the sector rotation is equally telling. Industrials, Utilities, and Technology—especially companies tied to AI infrastructure and grid modernization—have drawn steady inflows as rates eased and investors sought earnings visibility. The renewed bid for small caps reflects expectations that falling funding costs and onshoring investment will favor domestically oriented balance sheets. Put together, this looks less like a narrow melt-up and more like a market regaining breadth after two years of concentrated leadership.
Performance Review – Breadth Returns, Leadership Rotates
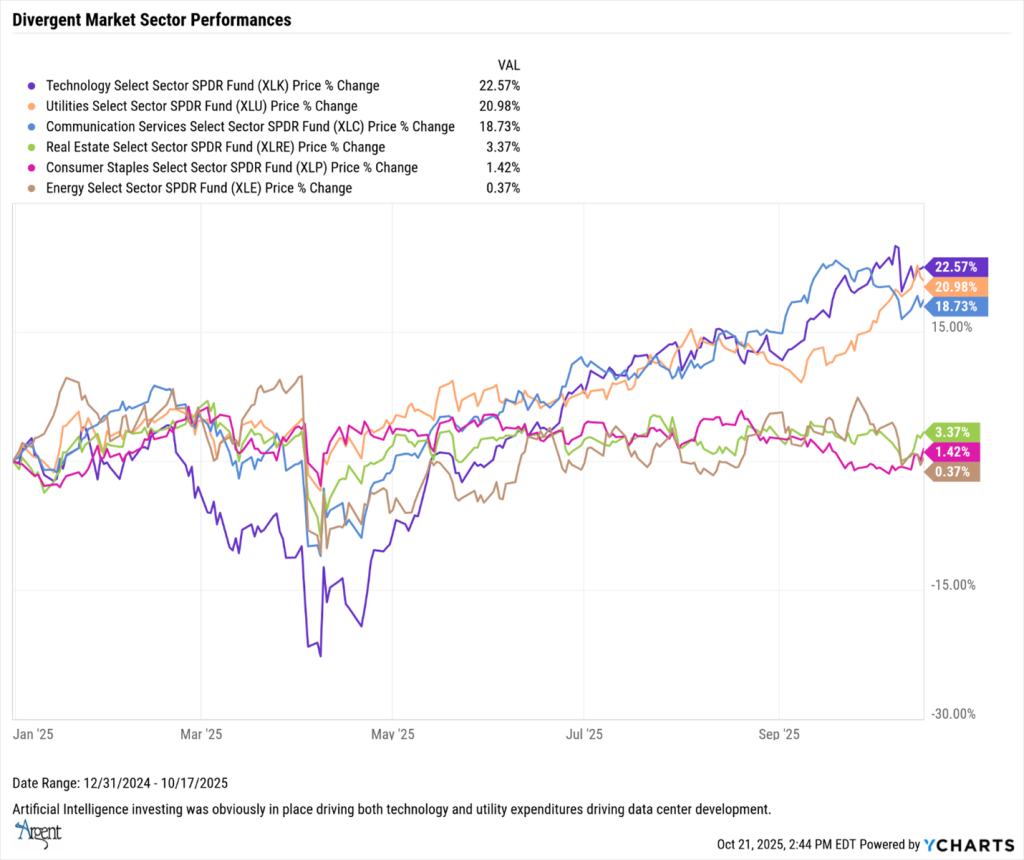
U.S. equities strengthened into mid-October. The S&P 500 is up about 13.7 percent year-to-date, the Dow 9.4 percent, and the Nasdaq 100 17.8 percent. Small caps regained traction, with the Russell 2000 back above its 2024 highs. That matters: when rate pressure eases, financing conditions for smaller, more domestically focused companies improve quickly, and leadership tends to broaden.
Top-three sectors year-to-date:
• Information Technology (+22.6%): AI supply-chain demand has supported semiconductors, compute, and resilient enterprise-software budgets.
• Utilities (+21.0%): Lower long yields and a durable investment cycle in transmission and generation have pulled income-seeking capital back to the group.
• Communication Services (+18.7%): Digital-ad recovery and better cost discipline at large platforms are translating to margin expansion.
Bottom-three sectors:
• Energy (+0.4%): Softer crude, higher OPEC+ output, and narrower refining spreads have offset balance-sheet strength.
• Consumer Staples (+1.4%): Pricing power is fading as volumes normalize and promotional activity returns.
• Real Estate (+3.4%): Cap-rate pressure from elevated financing costs continues to weigh, even with the 10-year below 4.1 percent.
Internationally, Japan leads developed-market returns for the reasons above; Europe is modestly positive on softer inflation and energy; Brazil and Mexico continue to ride near-shoring flows; and China remains volatile. The pattern on both sides of the Atlantic is the same: investors are rewarding profitability and cash generation, but they are also rotating toward industrial, utility, and small-cap exposures that benefit from easing rates and multi-year spending on the energy transition and AI infrastructure.
Strategy and Outlook – Navigating the Middle
October’s pattern fits a late-cycle economy that is slowing yet still advancing. Credit stress remains isolated, inflation is expected to edge lower, and policy has shifted from restraint toward support. The shutdown-induced data vacuum has amplified headline sensitivity, but the underlying signals—regional surveys, corporate guidance, and market leadership—are more consistent than the daily noise suggests.
Regional manufacturing readings captured the same nuance. The Empire State Index jumped to 10.7 (vs. –0.9 expected), while the Philadelphia Fed headline slipped to –12.8 (vs. 7.5 expected). Beneath those contrasting prints, new orders improved in both regions, shipments were steady, and price components ticked up modestly—not a reacceleration, but not deflation either. The Beige Book echoed “modest growth,” and Chair Powell’s October 16 remarks acknowledged that labor-market risks now outweigh inflation risks—a mildly dovish tilt that markets translated into roughly 50 basis points of additional easing by year-end.
With official data delayed, this week’s flash PMIs and the Chicago Fed National Activity Index will carry more weight than usual. A “too-hot” PMI could temper rate-cut odds; a “too-cold” print could re-ignite slowdown fears. Either way, volatility remains the toll for progress in a soft-landing scenario.
Pros and Cons Heading into Year-End
Positives
• Earnings momentum: Early Q3 results show broad beats and mid-single-digit revenue growth; forward guidance has shifted from pure cost control to selective investment.
• Consumer durability: Spending remains steady in services; travel metrics (occupancy, ADR, TSA throughput) confirm healthy demand; wage growth is cooling but remains positive.
• Policy flexibility: The 2s-10s curve is modestly positive; the Fed has room to cut if needed; the dollar’s strength helps contain imported inflation.
• Breadth and rotation: Small caps, Industrials, Utilities, and AI-infrastructure names are participating; leadership is less concentrated than it was.
Risks
• Tariff uncertainty: Pass-through to consumers is likely to rise into 2025; margins absorb pressure first, then households.
• Sticky core inflation: Services disinflation is slow; a premature re-acceleration would challenge the easing path.
• Valuation stretch: Mega-cap profitability justifies a premium, but multiples leave little room for disappointment; ex-tech earnings growth is modest.
• Credit lag: Funding costs for weaker balance sheets may fall more slowly than hoped; refinancing waves bear watching in 2026.
Playbook
Favor quality balance sheets and liquidity; add to structural themes—AI infrastructure, electrification, and critical materials—on weakness; avoid chasing momentum spikes. Late-cycle phases rarely travel in straight lines, but history shows they can still deliver meaningful returns before the eventual turn. The goal isn’t to time the end; it’s to navigate the middle with discipline and patience.
Not Investment Advice or an Offer -This information is intended to assist investors. The information does not constitute investment advice or an offer to invest or to provide management services. It is not our intention to state, indicate, or imply in any manner that current or past results are indicative of future results or expectations. As with all investments, there are associated risks and you could lose money investing.


