

Second Quarter Market Recap
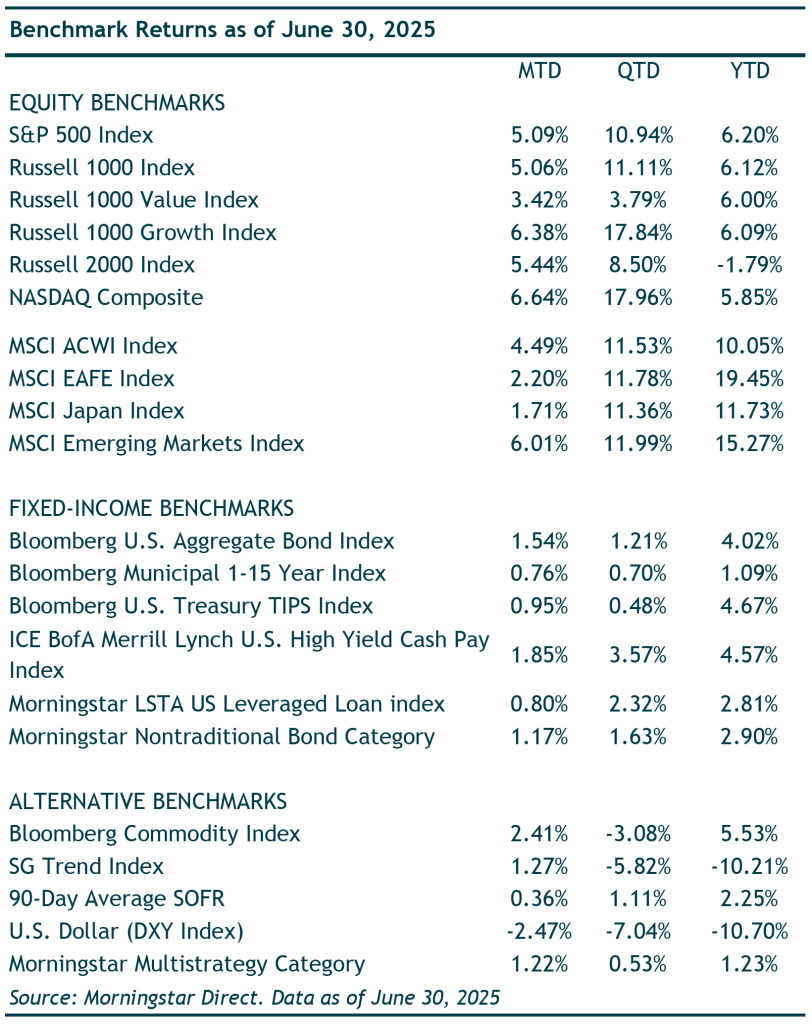
In the second quarter of 2025, global markets faced a complex mix of encouraging economic data, ongoing geopolitical uncertainty, and evolving global central bank policies. Nonetheless, the S&P posted a strong gain, reaching a new all-time high, and fixed-income markets were positive across most segments.
The S&P 500 gained 10.94% in the second quarter, driven by continued earnings resilience in the technology and communication services sectors. Year to date, the index is up 6.2%. The Nasdaq posted a stronger 17.96% return for the quarter, lifted by optimism around AI-driven productivity and corporate investment in cloud infrastructure. Small-cap stocks also moved higher in the three-month period, gaining 8.5%.
Internationally, developed market performance was also strong, gaining 11.78%. Importantly, most of this return is due to currency effects, specifically a weaker U.S. dollar. (In local currency, returns were 4.8%.) Emerging markets rose 11.99% benefiting from improving sentiment around China’s fiscal stimulus and currency stabilization efforts. Geopolitical risks, including ongoing instability in Eastern Europe and the Middle East, remain potential catalysts for volatility.
Within fixed income, our expectation has been that rates will remain volatile and range bound, which played out in the second quarter. The 10-year Treasury yield started the quarter at 4.23% and ranged between 4.01% and 4.58% before ending the quarter at 4.24%. In the period, investment-grade core bonds ended the quarter up 1.21%. Lower quality high-yield bonds were up 3.57% as investors’ appetite for risk increased.
Investment Outlook
Federal Reserve Policy
At their mid-June meeting, the Federal Reserve maintained the federal funds rate at 4.25–4.50%, marking the fourth consecutive meeting without a policy change. Chair Powell reiterated the Fed’s data-dependent approach, highlighting risks from tariffs and global uncertainty, particularly inflationary pressures stemming from U.S. trade policies.
The Fed’s updated Summary of Economic Projections revealed continued expectations for monetary easing, with the median forecast still projecting two quarter-point rate cuts by year-end 2025. However, internal division has emerged within the Federal Open Market Committee, as seven of the 19 officials now anticipate no rate cuts this year, suggesting they view the economy as stable with current rates appropriately positioned rather than overly restrictive.
The Fed’s policy decisions remain anchored to their dual mandate of price stability and maximum employment. Regarding inflation, Fed officials have acknowledged slower-than-expected progress toward their 2% target, with wage growth and shelter costs representing persistent challenges. Financial markets currently anticipate the first rate cut to occur in late Q3 or early Q4, timing that will ultimately depend on forthcoming inflation data and labor market metrics.
Inflation Outlook: Structural vs. Transient Forces
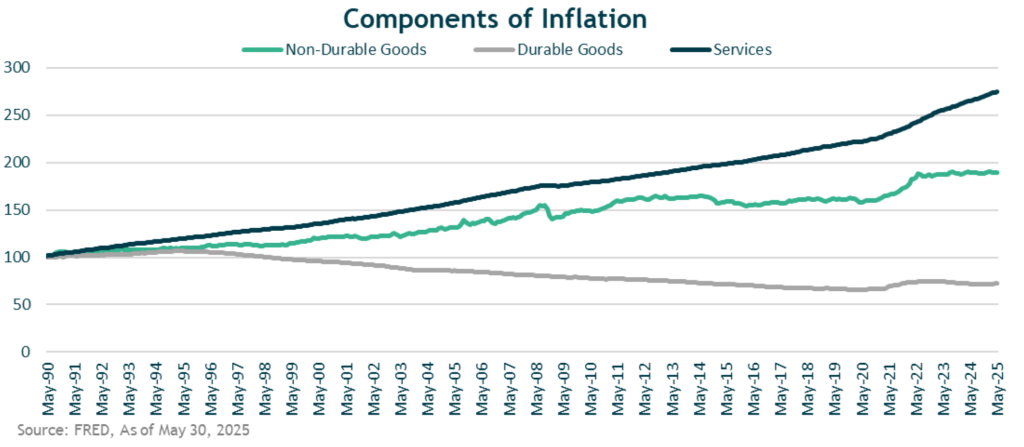
We believe inflation remains structurally controlled. The Consumer Price Index (CPI) excluding shelter has been below the Fed’s 2% target in 19 of the past 24 months. Services, specifically shelter, represent the primary inflation source, while durable and nondurable goods have remained flat to deflationary since 2022.
Money Supply and Demand Dynamics
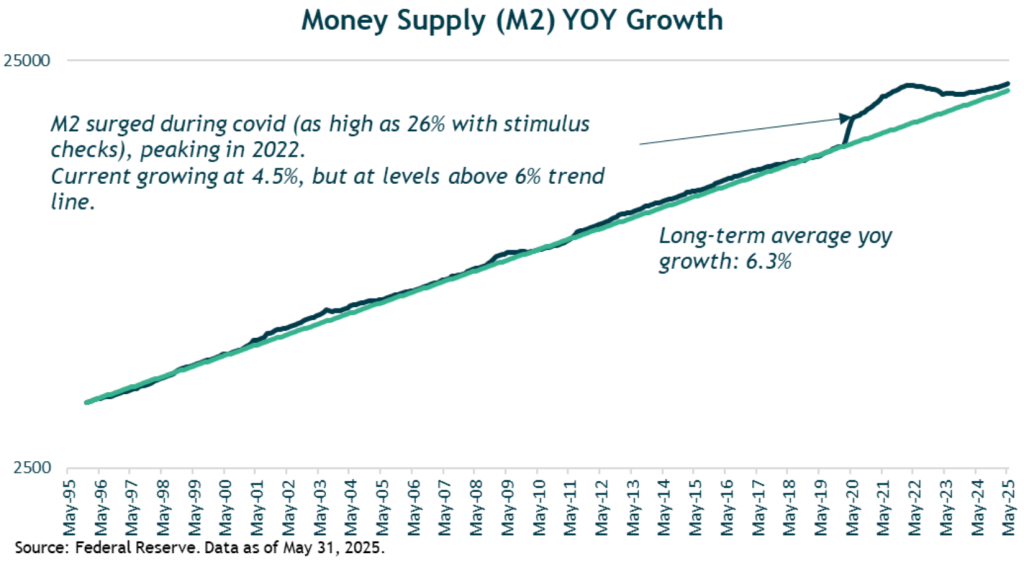
We assess structural inflation through two key measures: the balance of money supply and money demand. We use M2 as a barometer of money supply (tracking liquid assets such as savings and checking accounts, money market funds), and the inverse of money velocity as a measure of money demand—the desire to hold money rather than spend it, influenced by factors including income levels, interest rates, and economic uncertainty.
When these supply and demand measures are roughly balanced, inflation tends to remain relatively steady. Meaningful inflation swings typically occur when these measures fall out of balance. The post-Covid fiscal response provides a prime example: despite massive stimulus injections, inflation initially remained stable because the closed economy prevented consumer spending, creating proportional increases in both money supply and demand.
From 1995 through 2019, M2 grew at just over 6% annually during a period of relatively stable, low inflation—indicating balanced money supply and demand. However, the March 2020 M2 spike from stimulus didn’t translate to rising inflation until early 2021, when money demand collapsed as the economy reopened and consumers rushed to spend, particularly on services like travel. This dramatic imbalance, exacerbated by supply chain disruptions, resulted in the inflationary spike we experienced.
Current Assessment: “Gusts” vs. “Breezes”
We believe the structural forces that historically drive U.S. inflation—particularly the balance between money supply and demand—are currently in equilibrium. These structural forces, which we characterize as “gusts of wind” in the inflation landscape, tend to dictate inflation’s broader direction and persistence over time. Since the post-pandemic imbalance period, both money supply and demand have normalized, contributing to the overall disinflationary trend across much of the economy.
Simultaneously, we recognize that smaller, more transient forces—the “breezes” in this analogy—can still influence near-term inflation without overturning the broader trajectory. Current examples include tariffs, which we expect will exert upward pressure on goods prices. While unlikely to cause sustained inflationary spikes, these policy developments could complicate the near-term inflation picture and have reinforced the Fed’s cautious stance.
Another inflationary “breeze” we monitor closely is shelter, which carries meaningful weight in the services segment. Official shelter inflation measurements tend to lag reality by approximately 18 months and likely overstate current housing cost pressures. As more real-time housing data flows through, we expect this component to continue moderating, helping push inflation lower. While we view core inflation dynamics as fundamentally well-anchored, we continue monitoring these secondary influences for their potential to temporarily affect price paths and Fed policy decisions.
Economic Growth and Labor Markets
Labor Market Trends
The labor market is showing signs of deceleration and is unlikely to improve meaningfully, considering the rise in deportations. Unemployment ticked up modestly to 4.1% in June, with job openings declining across several sectors. Fed officials expect unemployment to rise to 4.5% this year (from 4%) and settle at 4.4% in 2027. Wage growth remains above pre-pandemic trends but has decelerated, potentially providing relief for the Fed’s inflation mandate in coming quarters.
Economic Growth
U.S. GDP growth in the second quarter is estimated to have reaccelerated to 2.5% annualized after contracting 0.2% in the first quarter, according to the Atlanta Fed, as of July 1, 2025. The first quarter’s GDP decline was primarily due to a surge in imports ahead of tariff announcements (imports represent a subtraction in GDP calculations). The Bloomberg consensus estimate for 2025 GDP growth is 1.4%. Consumer spending, though still positive, has recently shown signs of fatigue as households continue adjusting to higher borrowing costs and tighter credit conditions.
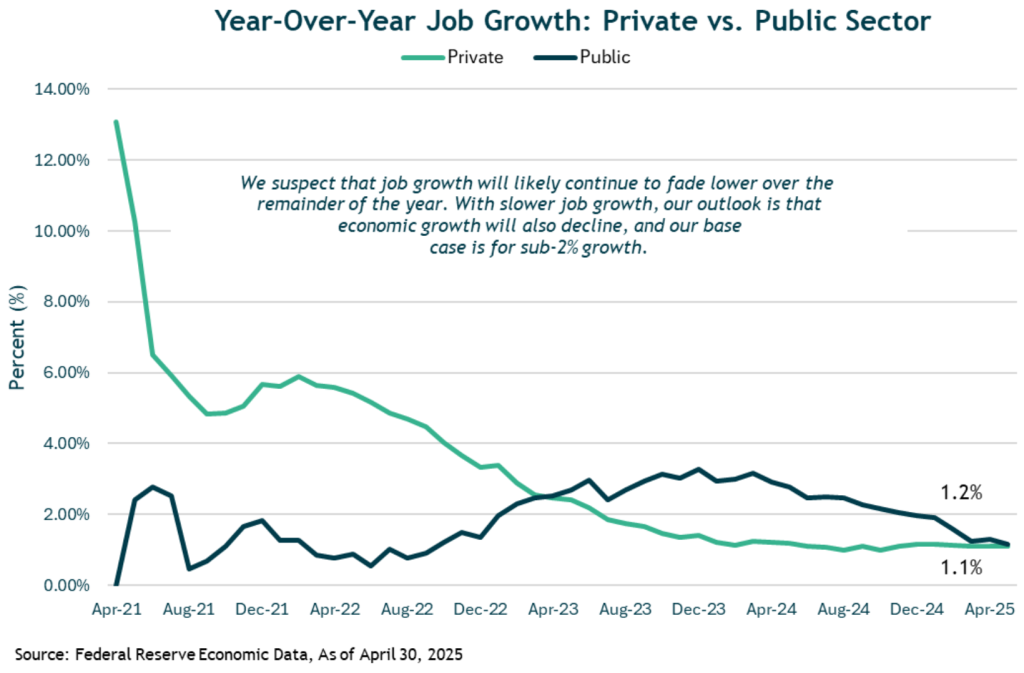
Year-over-year job growth for both private and public segments has slowed to just over 1%. We believe job growth could decelerate further from these levels, supporting only modest economic growth prospects.
Investment Implications
Given the current macro backdrop for inflation, a slowing but resilient economy, and expectations for policy easing, we remain positioned with a neutral equity allocation, diversified across the U.S., developed international, and emerging markets. While U.S. equity valuations are undeniably elevated by historical standards, that alone does not imply an imminent correction. Valuations have long proven to be poor timing tools, and in the context of where we are today, we believe U.S. (and global) equities have room to grind higher through the remainder of the year.
In fixed income, we continue to see opportunities to outperform the core bond benchmark. Rate volatility has subsided somewhat in the second quarter, and with the current backdrop we expect yields to remain rangebound between approximately 3.80% and 4.60% on the 10-year Treasury.
Overall, we remain underweight duration. This positioning reflects our view that attractive yield opportunities remain across credit (including high-quality and selective high-yield exposure) and securitized markets, allowing us to capture attractive income without overreaching for return and helping narrow the range of portfolio outcomes in an environment of still-evolving macro conditions.
Closing Thoughts
The second quarter’s equity rebound reflects growing investor optimism that a soft landing remains likely, with inflation easing and central banks, particularly the Fed, gaining room to cut rates. In the U.S., equity performance continues to be led by a narrow set of large-cap growth/technology stocks, though market breadth has improved modestly from last year.
Outside the U.S., valuation discounts for international stocks remain meaningful relative to the U.S., but currency dynamics and geopolitical uncertainty continue to present near-term risks. We see potential for select international exposures to outperform, particularly if the dollar continues to weaken alongside Fed policy shifts.
As we enter the second half of 2025, our outlook remains constructive but cautious. We believe markets will continue to be shaped by a tug of war between slowing economic growth and the prospect of rate relief alongside further resolution to the tariff situation and the upcoming legislation. We continue to think economic growth will slow but not collapse. Themes to watch in the remainder of the year will be Fed policy shifts, corporate earnings strength, and geopolitical risks.
As always, we remain committed to helping you navigate this dynamic environment with a disciplined, long-term approach. We appreciate your trust and support.
Certain material in this work is proprietary to and copyrighted by Litman Gregory Analytics and is used by Argent Financial Group with permission. Reproduction or distribution of this material is prohibited, and all rights are reserved.

