

The Month At-A-Glance
- Equities slid during the month as the U.S. Presidential election neared
- Interest rates rose thanks to favorable economic data, as well as in anticipation of a Trump presidency
- Donald Trump was elected to a second term as U.S. President in early November, setting off a rally in risk assets
Market Recap
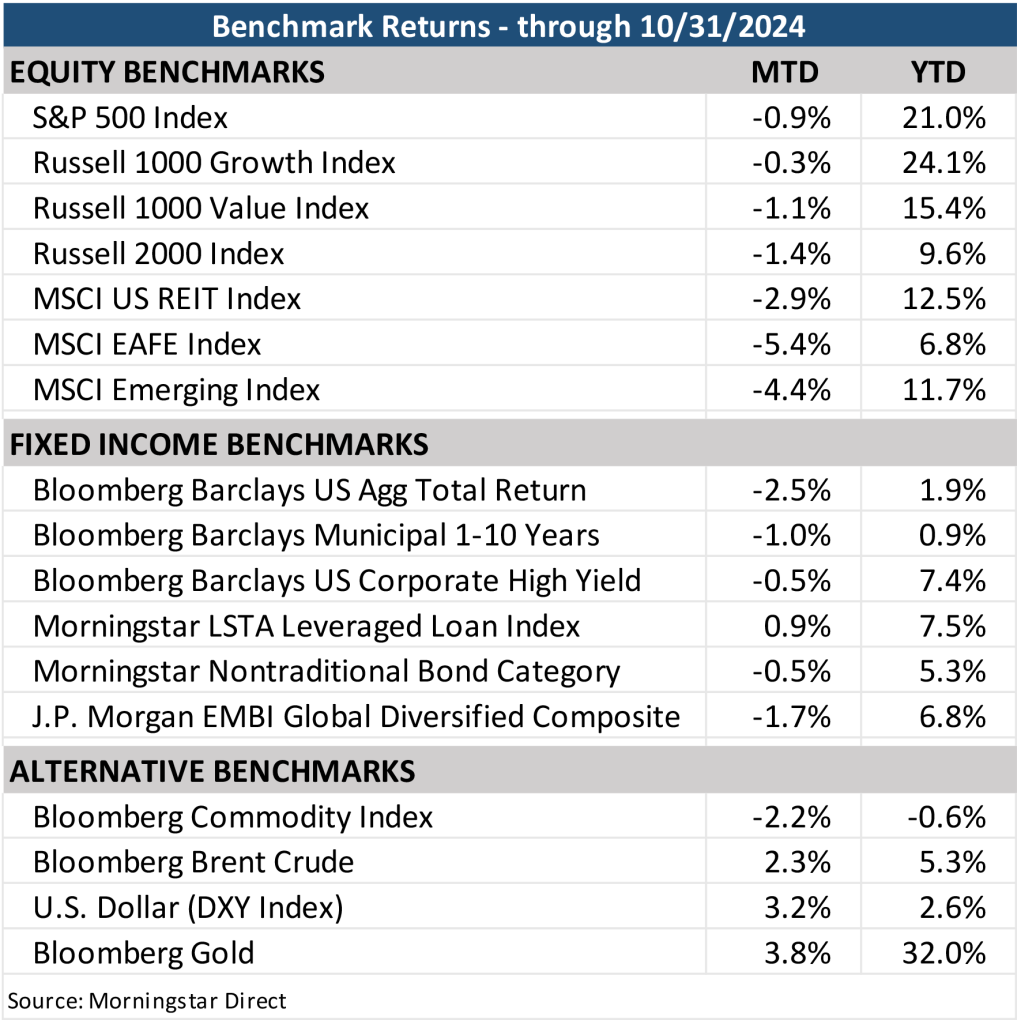
The S&P 500 declined 0.91% in October but reached a new all-time high intra-month. As has been the case for most of the year, large-cap companies outperformed smaller-cap companies, and growth stocks beat value stocks. The tech-heavy Nasdaq slipped 0.49% in the month.
Foreign stocks lagged the U.S. market, with developed market MSCI EAFE Index losing 5.4%. The emerging market fell 4.4% in a month where Chinese stocks were particularly volatile. Chinese stocks appreciated sharply intra-month after the country announced economic stimulus but then gave back most of those gains after questions arose around the effectiveness of that stimulus.
A stronger U.S. dollar was a headwind for foreign returns. The Dollar Index increased more than 3% during the month. Local foreign returns were meaningfully better when the dollar impact was excluded. MSCI ACWI ex.-U.S. was down just 1.8% in local currency terms but fell nearly 5% in dollar terms.
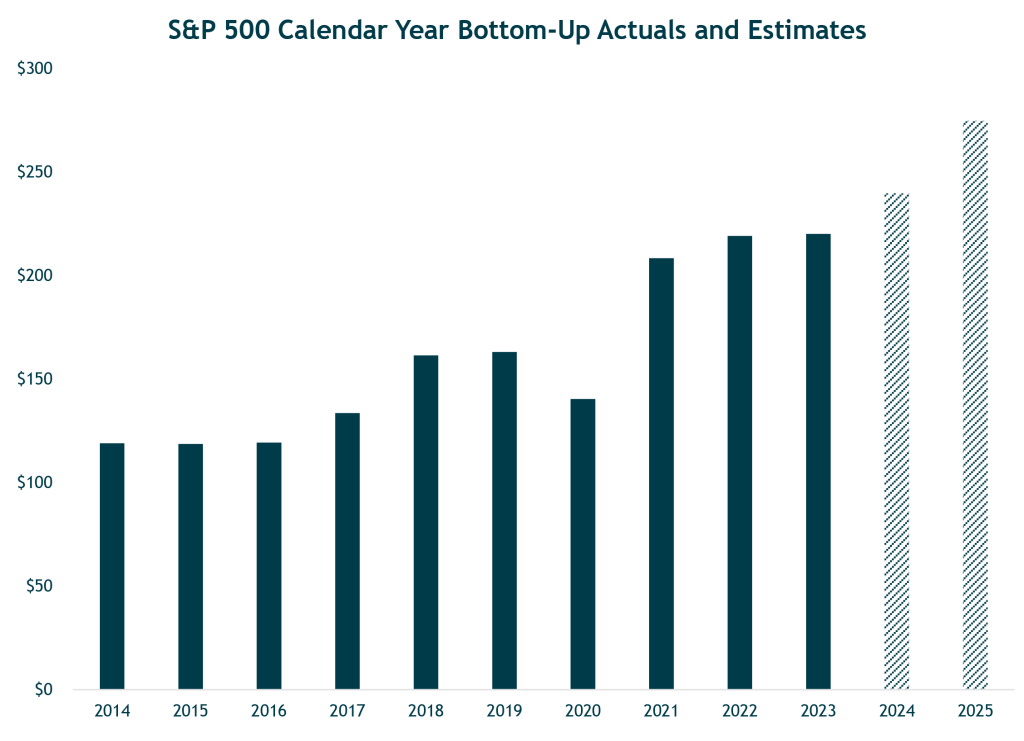
As of this writing, roughly 70% of S&P 500 companies have reported earnings for the third quarter. According to the financial data company FactSet Research, 75% of companies reported earnings above consensus estimates, which aligns with the 10-year average. Earnings growth is currently expected to be 5.1% for the third quarter. Looking forward, FactSet estimates 9.3% earnings growth for the calendar year 2024 and another 15.1% growth in 2025. After middling earnings growth in 2021 to 2023, the expectation is for double-digit growth going forward.
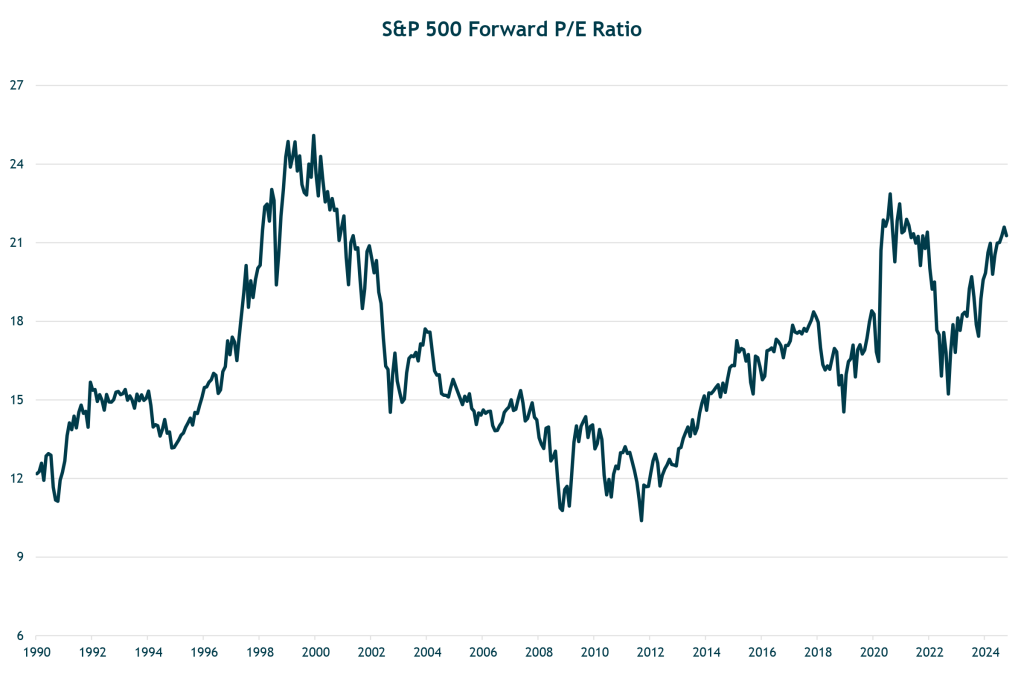
Earnings growth will be critical as valuations for U.S. large-cap equities are elevated, i.e., the market is already pricing in strong future earnings. The forward P/E ratio on the S&P 500 stands at over 21x. This is well above the five-year average of 19.6x and the 10-year average of 18.2x. While elevated, it is a couple of points below the last two valuation peaks (late-90s and late-2020) when earnings multiples were in the 24-25x range. Valuation multiples are ultimately a proxy for investor sentiment and how much investors are willing to pay for $1 of earnings. Predicting valuation levels in the short term is notoriously difficult, but what we do know is that high valuations can imply lower equity returns over subsequent years. If earnings growth does not materialize, causing multiples to return to average valuation levels, there is a meaningful downside risk for stock prices.
Within fixed income, bond market volatility was elevated in October. As economic data continues to suggest that a recession can be avoided, or at least delayed, the bond market has reset its expectations for the future level of rates. After believing the Fed would need to cut more than their latest forecast by the end of the month, the bond market implied the Fed would need fewer rate cuts. During the month, the two-year Treasury yield rose from 3.66% to 4.16%, and the 10-year Treasury rose from 3.81% to 4.28%. Some believe the so-called “Trump trade” played a role in higher rates, as the anticipation of a second Trump presidency would result in higher inflation. We believe this could have been an incremental factor, but we believe higher rates had more to do with favorable economic data.
The labor market seems relatively stable as it continues to normalize in the years following the pandemic, but there are some blemishes worth monitoring. We have not yet seen any signs to suggest that the labor market is crumbling, but it has softened from the strong post-COVID conditions.
A strong labor market is generally inflationary, while weakness can indicate the potential for a slowing economy or even recession. The Fed’s dual-mandate policy (persistently low inflation and maximum employment) is trying to balance these two considerations with the goal of achieving a “soft-landing” that avoids both recession and too-high inflation.
As for inflation, our current outlook is that the primary forces that influence prices are in relatively good balance. Specifically, we are referring to the supply and demand of money. With today’s backdrop, we would not expect a meaningful change in the immediate term unless one of these factors shifts.
Our view has been that the flood of money supply via government stimulus during the pandemic significantly increased the supply of money. (We measure money supply using M2, a government metric that includes liquid retail assets such as currency, savings and checking accounts, etc.) But this stimulus was met by an equally strong demand for money (we use the inverse of the velocity of money) as the economy was locked down, which helps to explain why inflation did not show up until the economy reopened. The reopening of the economy led to a flood of money pouring back into the economy, and this surging demand pushed prices higher, which was exacerbated by supply chain shortfalls.
Today, year-over-year money supply is growing modestly (2.6%), while money demand is slightly elevated when compared to pre-pandemic levels. If these current conditions persist, we expect inflation to be range-bound in/around current levels for the immediate term. Looking ahead, however, we think there are increasing pressures that could result in a higher level of inflation. These include growing national fiscal deficits, tariffs, the “greenification” of the economy, and deglobalization.
2024 Election
The 2024 Presidential election has come to an end with Donald Trump elected as the 47th President of the United States. Many polls had called the election too tight to call in the days prior, whereas a wider gap in favor of Trump had opened up in betting markets. Ultimately, President-elect Trump won the crucial swing states. While two of the seven swing states have yet to be officially called, it looks like Trump will have won all seven swing states. And at most recent count, he is ahead by nearly 4 million votes in the popular vote (though this will likely shrink somewhat since the populous California has only reported about two-thirds of their votes four days after the election). Additionally, Republicans have control of the Senate and are six seats away from having majority of the House of Representatives.
Much like in the day following Trump’s victory in 2016, equities rallied, and Treasury yields increased. The S&P 500 rallied 2.5% on Wednesday, November 6th, and smaller-cap stocks jumped 5.8% on the day. Longer-term interest rates moved sharply higher, causing the core bond index to fall by 0.74%. Much like in 2016, foreign stocks severely underperformed, with emerging markets losing 0.6% and developed international stocks falling 1.3% due to concerns about changing geopolitics.
Which of President Trump’s policies get implemented remains to be seen. But broadly, he campaigned on extending lower personal income taxes, lower corporate tax rates, higher tariffs, immigration controls, and deregulation. The risk of higher tariffs and focus on the domestic economy played out in the day following the election (i.e., foreign stocks posting losses versus U.S. small caps rising sharply). How his proposed agenda takes form necessitates watching, as does the Fed’s reaction.
Certain material in this work is proprietary to and copyrighted by Litman Gregory Analytics and is used by Argent Financial Group with permission. Reproduction or distribution of this material is prohibited, and all rights are reserved.

