


BY: Tom Stringfellow, CFA®, CPA®, CFP®
Chief Investment Strategist
Pivot Points
- Market odds are increasingly favoring a September rate cut.
- Q2 GDP report was an upside surprise, with initial economic growth estimates of 2.8% versus last year.
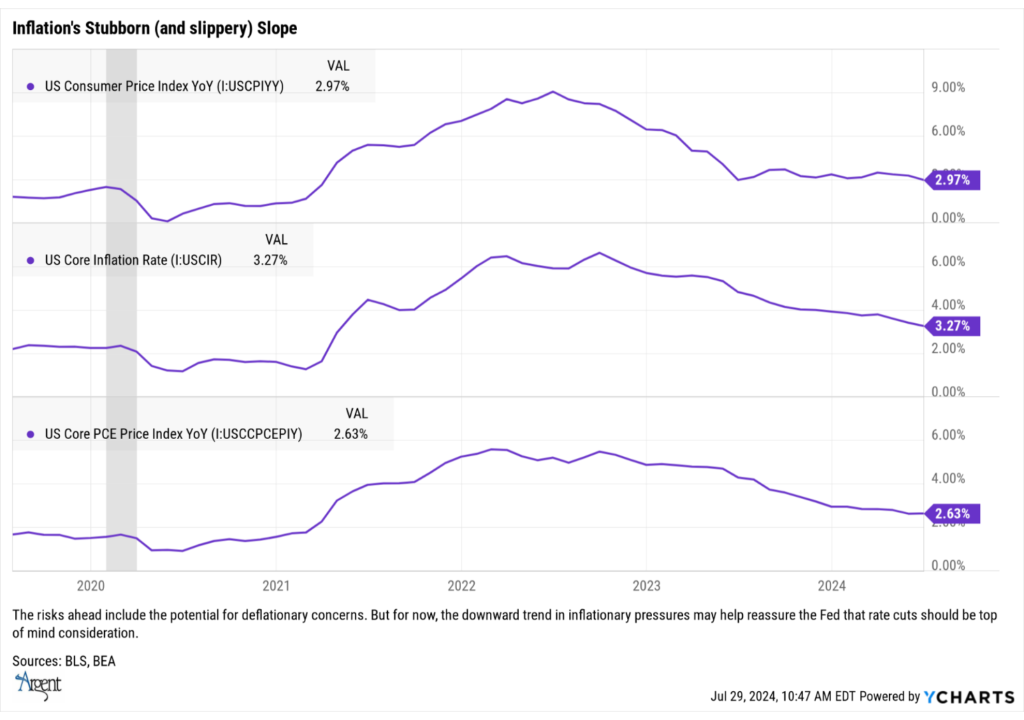
- Annual Core Inflation rate for June was 3.3%, compared to 3.4% in May. Headline Consumer Price Index (CPI), which includes the more volatile seasonal factors, rose by 3% compared to the previous month’s reading of 3.3%.
- Small cap stocks (IWM) were up 10.5% this month through July 26.
Changing Tenor
With only a few trading days left in July, discussions are increasingly centered on the exact timing of the Federal Reserve’s anticipated rate cut. The question of “whether it will happen” has long been settled; the focus now is on “when.” Recent data has expedited the urgency of this question. While the Federal Reserve Board’s voting members are meeting this week, there are no real expectations for a rate cut in the immediate future. However, expectations for a September cut are high, and the futures markets are currently pricing in a rate cut of three-quarters of a percent by this year’s end.
The anticipation of this rate cut has accelerated against a backdrop of evolving economic indicators, including recent housing and labor market data. Although recent reports, such as last week’s GDP report, might push back on a September rate cut from a few Fed members, the growing consensus is that monetary policy changes will take action sooner rather than later to avert an economic crisis further down the road.
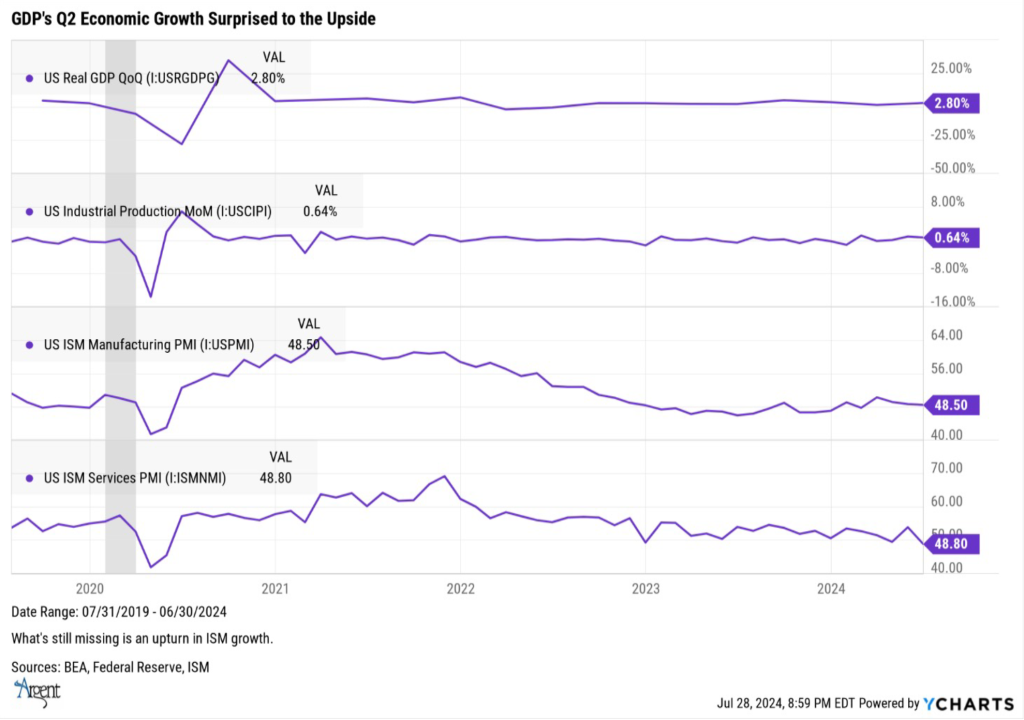
Over the past several weeks, emerging fears that the US economy was starting to slow have been evident despite several positive fundamentals, which until recently included the jobs market. This past week’s gross domestic product data (GDP), however, painted a more upbeat picture, showing that GDP had increased by an annualized rate of 2.8%, as reflected by the preliminary second-quarter report.
In fact, real GDP reflected increases in consumer spending, private inventory investment, and nonresidential fixed investments compared to the earlier quarter this year. Other notable improvements included personal consumption expenditures—a proxy for consumer spending—up by 2.5%, which was in line with estimates. In this category, healthcare, housing, utilities, along with recreational services, motor vehicles, and goods consumption accounted for much of the growth.
One of the standout categories, however, was business investment, up 5.2%, the highest in nearly a year, with gains primarily in equipment investment at 11.6%—the strongest in over two years—and intellectual property spending increasing by 4.5%. The increase in equipment spending was primarily driven by transportation, up almost 50%, mainly due to aircraft expenditures. Not surprisingly, government spending was also up 3.1% due to increased defense spending.
From a market standpoint, this second-quarter GDP report was positive as it counters ongoing slowdown concerns. However, the report reflects what happened over the prior three months, and the real question is what the economy will look like over the next several quarters. The more recent Institute for Supply Management (ISM) data portrays a more muted growth environment, with both the Manufacturing and Services industry data showing a slightly contracting environment.
Economic activity in the manufacturing sector fell in June for the third consecutive month and the 19th time in the last 20 months. One of the more visible issues outside of weaker demand in June was company management’s reluctance to invest in capital and inventory, given the current rate of interest. Those industries countering the slowdown were primarily in the energy and commodity businesses.
The services sector also booked a slowdown, its second decrease in three months. Perhaps more significantly, the index fell below the economic growth threshold level for the first time in 18 months. Of particular interest for the upcoming Fed meeting was the contraction in the largest industry in the sector: Real Estate, Rental, and Leasing. According to ISM data, this segment, accounting for 14.9% of the services industry’s GDP, was the fastest-growing in May but one of the casualties in the June report.
Overall, the mixed signals from different economic indicators create a complex backdrop for the Federal Reserve’s upcoming decisions. While the GDP report provides some reassurance, the ISM data suggests caution, highlighting the challenges in balancing growth and inflation. The Fed’s actions in the coming months will be crucial in navigating conflicting signals while maintaining economic stability. But for now, two forecasts we have are from the Atlanta Fed GDPNow model, projecting Q3 GDP to grow again by an annualized 2.8%. The second prediction, also based on fluid data, is the potential of an upcoming rate cut, which will hopefully be gleaned from this week’s Fed meeting.
Inflation’s Slip
The recent inflation data reflects a mixed but generally improving picture for the U.S. economy. Here’s a breakdown of the key points:
1|Core Inflation:
• The annual Core Inflation rate for the 12 months ending in June was 3.3%, slightly down from 3.4% in May.
• Core Inflation excludes volatile items like food and energy.
2| Headline Consumer Price Index (CPI):
• The annual CPI, which includes food and energy, rose by 3% in June, compared to 3.3% in May.
• Both Core Inflation and CPI are significantly lower than their post-pandemic peaks. CPI peaked at 9.1% in June 2022, and Core Inflation peaked at 6.6% in September 2022.
3| Impact of Energy and Food Prices:
• In June 2022, energy prices (West Texas Crude) reached $121 per barrel, driven by the early months of the Ukraine war. Currently, prices are about 33% lower at $81 per barrel.
• Grain prices, also affected by shortages from Russia and Ukraine, were 31% higher in June 2022 compared to today.
• These factors contributed to the higher CPI readings in the summer of 2022.
4|Housing Costs:
• Housing costs, included in both Core Inflation and CPI, have risen nearly 46% from June 2020 to April 2024, according to the Case-Schiller National Home Price Index.
• This increase is driven by a shelter shortage relative to demand and rising interest rates.
5| Personal Consumption Expenditure (PCE) Index:
• The PCE Index, the Fed’s preferred measure of consumer spending, excluding food and energy, held steady at 2.6% last month.
•The continued decline in PCE suggests that inflation is responding to tighter monetary policies, reducing fears of an inflation relapse.
Outlook
The overall data indicates that inflation is moderating, which may lead to the Federal Reserve considering a rate cut by the September meeting. This perspective is based on the steady decline in the PCE index and the decrease in both Core Inflation and CPI.
The Market Scorecard
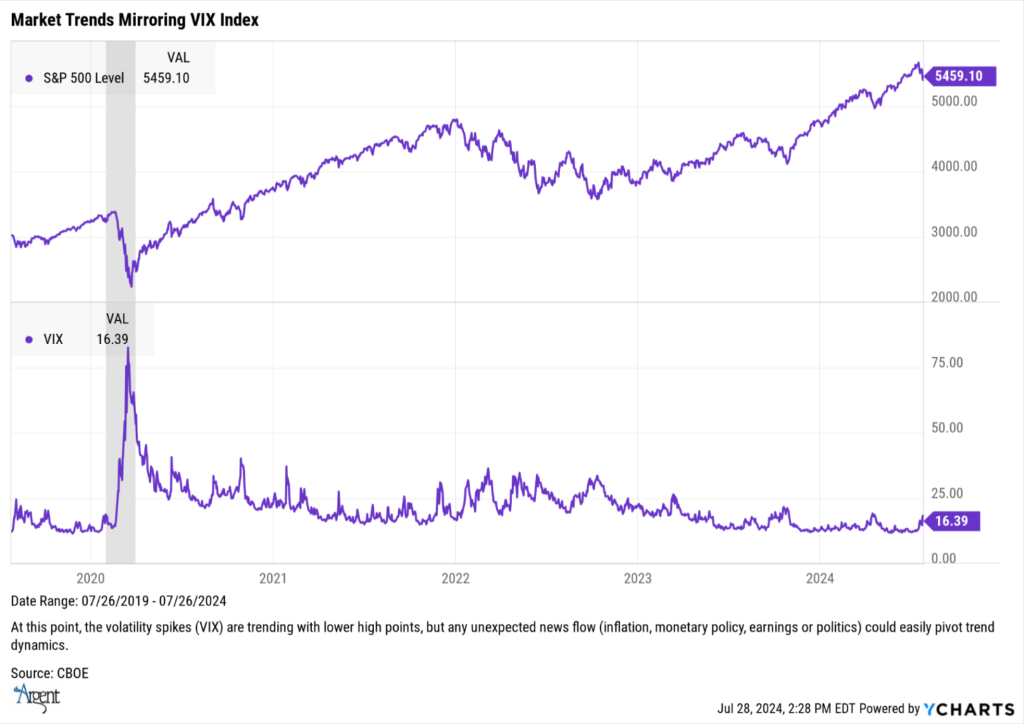
The S&P 500 has delivered strong returns year-to-date (YTD), with a performance of +14.5% as of July 27, 2024. This comes in the backdrop of several market-moving factors, including earnings reports, monetary policy expectations, extended price multiples, and upcoming election concerns. Despite these issues, the market has shown resilience, although slightly underperforming compared to the same period last year, which saw a +19.34% return.
Performance Comparison:
- 2024 YTD (through July 26): +14.5%
- 2023 YTD (through July 26): +19.34%
- Spread: -4.84%
The S&P 500’s performance this year, though slightly lower than last year, reflects improving underlying market fundamentals but with still wavering investor confidence. The resilience shown by the market in the face of these primary volatility drivers, however, is a positive sign for continued market upside.
Volatility Analysis
- VIX Trends: The Volatility Index (VIX) has been relatively lower this year compared to the heightened levels seen during the pandemic and the subsequent recovery years of 2020-2022. This suggests a more stable market sentiment, even as headlines continue to drive short-term fluctuations.
- Key Drivers of Volatility:
- Earnings Reports: Quarterly earnings have been mixed, with some sectors outperforming expectations while others lag. The market has been particularly sensitive to guidance and outlook statements from major corporations.
- Monetary Policy: The Federal Reserve’s actions and communications regarding interest rate hikes and inflation control have been closely watched. Any indications of tightening or easing policies have direct impacts on market volatility.
- Extended Price Multiples: High valuations in certain sectors have raised concerns about potential corrections. Investors are cautious about overpaying for growth in a high-interest-rate environment.
- Political Uncertainty: The upcoming election adds another layer of uncertainty. Historically, election years have seen increased volatility as market participants try to gauge potential policy changes and their impacts.
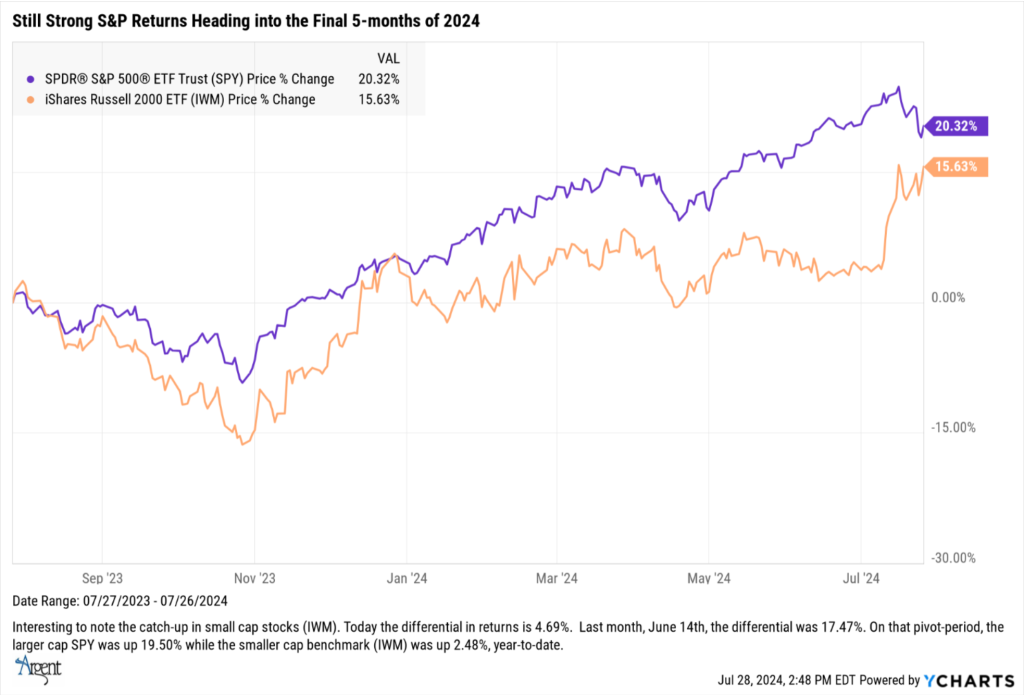
With respect to the broader markets, the overall returns have also been attractive, although July presented some challenges. In July, the S&P 500 essentially flattened out for the month, while the NASDAQ declined by about 2%. In contrast, the Equal Weight S&P (RSP) saw an increase of about 3.3%, and the Russell 2000 small-cap universe (IWM) delivered a surprising 10.5% return through July 26.
The Russell 2000’s performance highlights a significant shift, especially given its “catch-up” with larger-cap stocks starting around June 14. The variance between small and large-cap stocks decreased from over 17% to about 4.7% as of last Friday, driven by factors suggesting an imminent rate cut and the possibility of a soft economic landing, both crucial for small businesses. Suspected drivers of the performance were most likely:
- Anticipation of a rate cut has provided optimism, particularly for small-cap stocks.
- Falling Inflation, and in turn, boosting investor confidence.
- Continued positive economic indicators have supported market stability and growth.
- AI remains a significant growth driver, with many companies incorporating AI into their strategies.
Upcoming Influences
- This week, the release of key data from the Federal Reserve regarding rate-cut intentions and timing will be of utmost importance. With data indicating a slowdown in inflation, the focus will shift to the Fed’s actions and their potential impact on market sentiment. Additionally, the release of improving earnings news will be crucial in sustaining market momentum.AI should continue to be a significant positive factor. Companies are increasingly integrating AI into their growth strategies, bolstering investor confidence and driving market performance.
- It will be a substantial negative surprise if the Fed does not indicate a September rate cut. Market expectations are leaning heavily towards this outcome, which has been a significant driver of recent market behavior.
The Path Ahead
Recent economic data and market trends suggest that the Federal Reserve may be poised to implement the first rate cut in September. While the upcoming Fed meeting this week might reveal the first cut, such a move would be an unexpected surprise. Here’s an in-depth look at the current economic landscape and its implications.
- Inflation data over the past few months has shown signs of cooling, creating a favorable environment for a potential rate cut. The expectation of a rate reduction is bolstered by the Federal Reserve’s signals and market anticipations. However, a cut this week would be considered an outlier surprise.
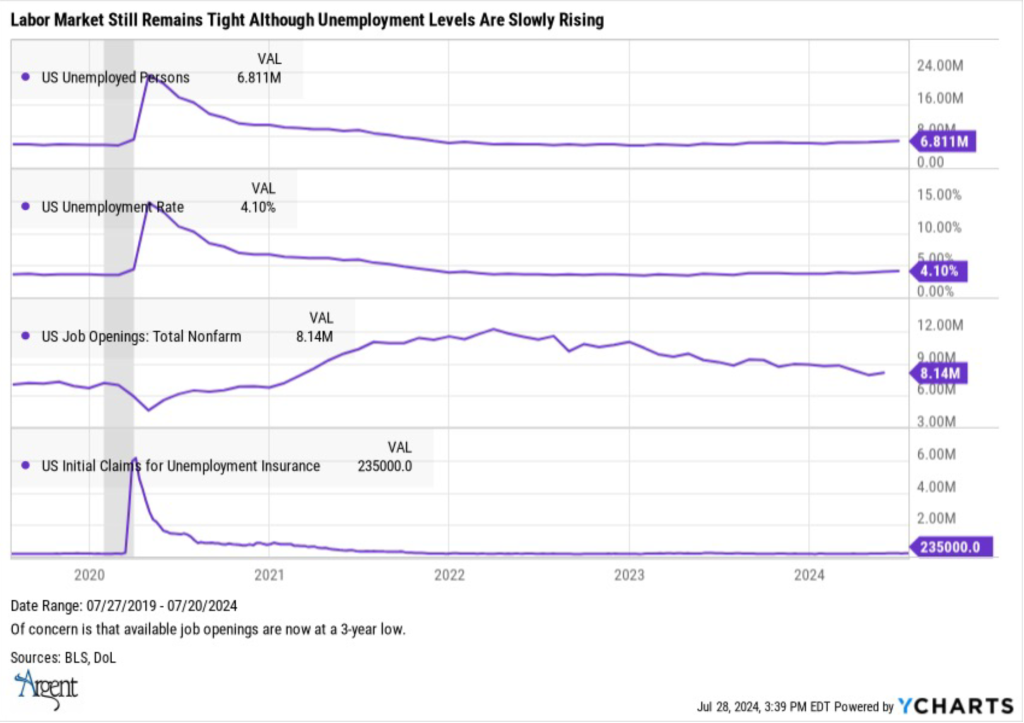
- The labor market has reached a more balanced state.
- Unemployment Rate: Currently at 4.1%, indicating a stable job market.
These factors suggest that the fear of persistent job shortages driving higher inflation is no longer a significant concern. But also of concern is the housing markets:
Housing Market Trends
- New Home Sales: Fell by 0.6% in June and have decreased by 7.4% over the past 12 months.
- New Homes Sold but Not Yet Started: Down by 35%, highlighting the impact of tighter monetary policy.
These trends indicate that prolonged high interest rates may be destabilizing the housing market rather than controlling inflation.
Implications and Outlook
The combination of balanced labor markets and a slowing housing sector supports the case for an imminent rate cut. Key factors include:
- Impending loosening of Fed Monetary Policy: Anticipation of a rate cut has been a significant driver of market optimism.
- Falling inflation: Recent data showing a slowdown in inflation strengthens the case for a policy shift.
- Improving corporate earnings estimates: Continued positive data, particularly in the technology and consumer sectors, as well as interest rate- sensitive businesses, would provide a stable backdrop for market performance
Not Investment Advice or an Offer -This information is intended to assist investors. The information does not constitute investment advice or an offer to invest or to provide management services. It is not our intention to state, indicate, or imply in any manner that current or past results are indicative of future results or expectations. As with all investments, there are associated risks and you could lose money investing.

