


BY: Tom Stringfellow, CFA®, CPA®, CFP®
Chief Investment Strategist
Data Neurosis
- Earlier in April, the market risk VIX index increased nearly 48% from a reading of 13.01 to 19.23. A brief market sell-off quickly followed.
- Today, the number of stocks holding above the S&P 500, 50-day moving average, has fallen to 49%, off nearly 41% from March’s quarter-end.
- Core CPI holding steady at 3.8%, and personal consumption expenditures (PCE) posting an annual 2.7% inflation growth.
- The economy is not at risk at this point but still has momentum that is the Fed conundrum (questioning whether another rate cut is warranted).
Recall just a few short weeks ago, returns for the first quarter ended on a positive note with all three months contributing to rising market returns. Technology remained the primary market driver as anything “AI” related (artificial intelligence) seemed to be the “smart” investment. During the initial three months, quite a few market sectors registered positive returns, with energy, communication, and financial sectors all delivering 10% plus increases. At March’s close, 83% of the S&P 500 stocks were above their 50-day moving average, and patient investors realized potential returns of over 10%.
But the breaking news these past few weeks has kept central bankers and market watchers on edge. On April 4, fighting in the Middle East intensified with a senior Iranian military officer killed in Syria by an Israeli strike. This ultimately led to a barrage of Iranian missile strikes within Israel’s territory, shortly followed by Israeli tactical retaliation.
This distraction, aside from the continuing escalation between Russia and Ukraine and ongoing container ship disruptions along the Suez Canal as Houthi rebels continued attacking freighter traffic. According to an overseas government regulator, Office of National Statistics, ship traffic crossing through the waterway dropped by 66% in the first week of April, now being re-routed around Africa, a much lengthier and expensive route.
As expected, nervous markets reacted with oil prices spiking from February’s low of $72.16 for West Texas Intermediate crude to nearly $87 by April 5. While gasoline prices increased lagged oil prices by a few weeks, prices caught up, with today’s average gas price now at $3.60 per gallon, up 19% from the January low of $3.02. Although this past week has seen some calming in the Middle East, oil prices remain elevated at $83.72.
The heightened tension overseas proved to be a spoiler for investors as well. With market and economic risks on the rise, market risk measured by the VIX index increased by nearly 48% from an index reading of 13.01 to 19.23. As expected, market impact quickly followed, with the S&P 500 falling by 5.5% from the end of March through April 19. As of this past Friday (April 26), volatility has dampened a bit, with the VIX index settling down to a reading of 15.3. The S&P 500 also recovered slightly, although still off by 2.7% from the March-end quarter. Government bonds were also impacted by the equity sell-off, with yields on the 10-year Treasury now sitting at 4.67%, up from 3.79% last December’s close and 4.20% from March 28.

The Backdrop Today
Conflicts overseas continue to add confusing market signals. Market volatility has become a compilation of politics, debt levels (personal and national), and back-and-forth guesstimates on the timing and magnitude of rate cuts on the Fed’s docket. For a few, the real question should be whether rate cuts are really needed given the current state of the economy.
While there is still considerable mixed messaging from consumers, economic data, market volatility and political conversations, the economy is performing fairly well. This is considering the truly historical global “upending” that began in early 2020 and which today, world markets continue working towards lost momentum.
Unfortunately, at the beginning of the year, investors (ourselves included) were expecting at least three rate cuts and growth. This past week, however, there were several speakers, including Fed Chair Powell, with a rather consistent message, inflation has yet to fall to expected levels, implying no rate cuts in the near future. Markets quickly reacted, pushing rates higher and stocks lower. Today, the number of stocks holding above the S&P 500 50-day moving average has fallen to 49%, off nearly 41% from March’s quarter-end. Meanwhile, Treasury yields have risen, forecasting future inflation rates on the fly. As of this past Friday, April 26, Treasury yields once again look attractive, with yields of 4.67%for a 10-year note. Of course, the 3-month 5.47% Treasury yield looks as attractive as most dividend stocks, but certainly without the appreciation opportunity.

Economic Growth
A report from the International Monetary Fund (IMF) released this month pointed to a forecasted global economic growth rate for advanced markets of 3.2% in 2024 and 2025 and an expected U.S. growth rate of 2.7% this year and 1.9% in 2025. Also interesting, the IMF is forecasting 4.2% economic growth rates in the emerging and developing markets this year and next, with India leading the pact, expecting growth of 6.8% this year and 6.5% in 2025. No recessions on the watch yet, even as interest rates remain at slightly elevated levels.
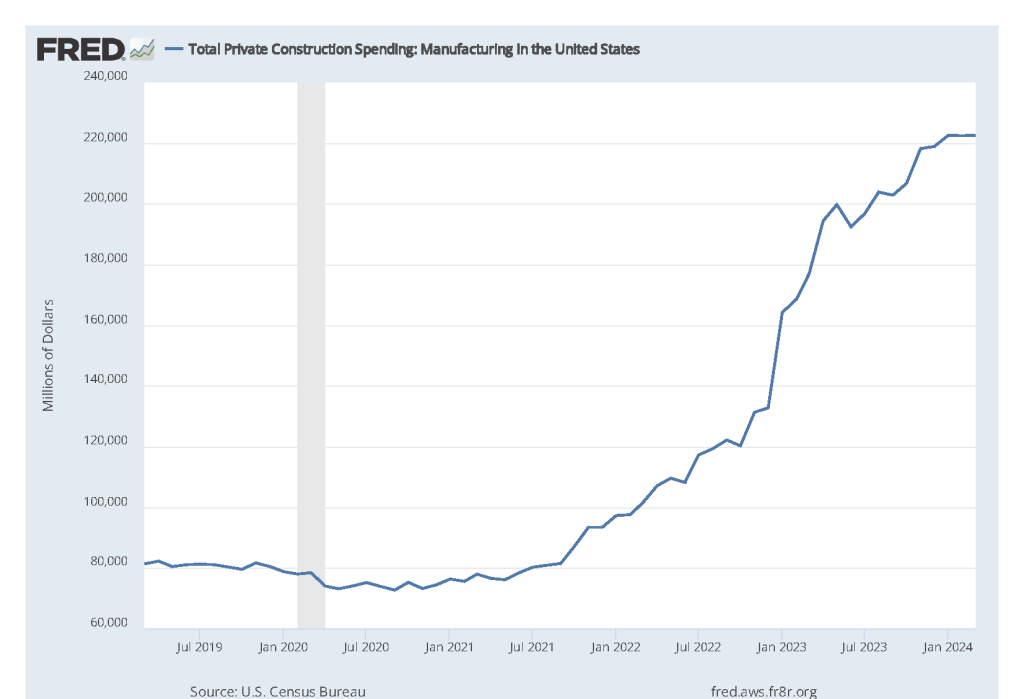
And although last week’s preliminary release for U.S. GDP growth was somewhat underwhelming, reporting an annualized growth of 1.6%, there was still positive trending in personal consumption, up 2.5%. This is coupled with improving growth levels in both residential and non-residential fixed investment. One firm, Bespoke Research, noted that construction of factories is now at a 40+ yr. high share of GDP, and according to Fed data, the annual investment in new manufacturing facilities hit nearly $225 billion dollars this year, a record high even after adjusting for inflation. This will be a boon for both U.S. manufacturing and the skilled labor markets. Data has not yet been realized in recent GDP, manufacturing, or labor market releases.
Inflation and the Fed
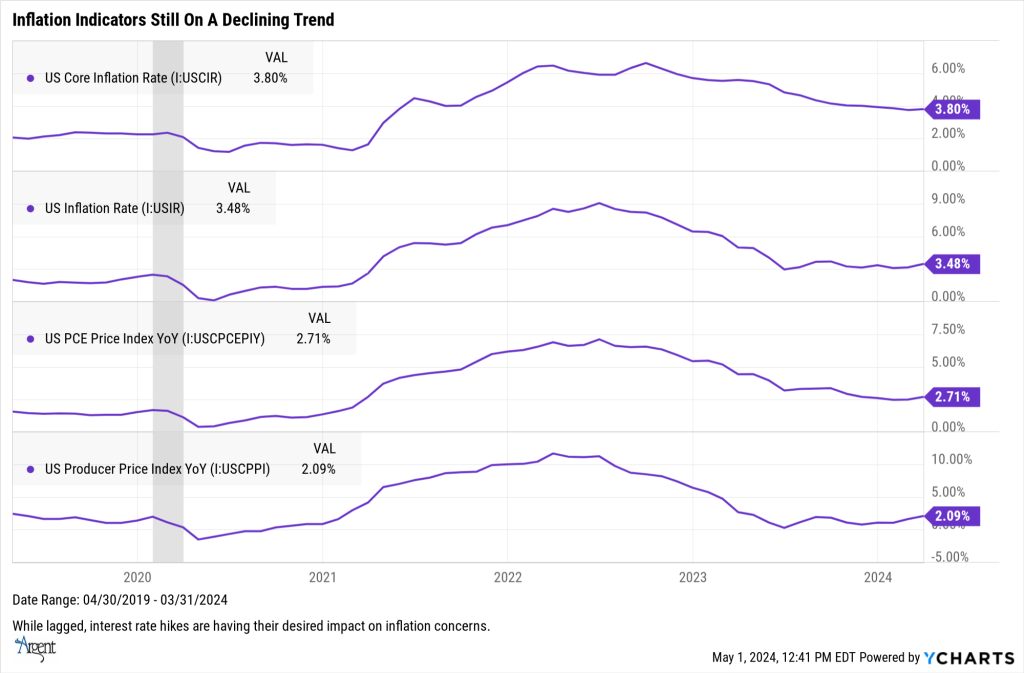
The recent inflation data published for March continues pointing towards still relatively sticky levels of inflation. One glaring component, Rent and Owner’s Equivalent Rent, comprising 41% of the inflation index (CPI), were both up 0.4% over the prior month. Also evident from the accompanying chart is that inflationary trends that began spiking in early 2021 through 2022 resulted primarily from pandemic “shut-in” consumption demand, manufacturing shutdowns and logistic bottlenecks. Last year, those inflation trends began reversing, which, to some Fed Watchers’ chagrin, means that the downturn in inflationary pressures may have stalled to levels possibly reflecting a new “neutral” range.
Meanwhile, with Core CPI apparently holding steady at 3.8% and the Fed’s favorite, personal consumption expenditures (PCE), posting an annual 2.7% inflation growth, it wouldn’t be surprising if the Fed’s push to cut interest rates stalls for the next few months. While core PCE prices were actually up 2.8% year-over-year, it was obviously better than what investors expected, given the April week’s-end rally. Unfortunately, it won’t alter the fact that rate relief won’t likely be on the table for a few more months. Several policymakers had already begun to push back on rate cuts, including Fed Chair Jerome Powell, noting last week that “recent data have clearly not given us greater confidence and instead indicate that its likely to take longer than expected to achieve that confidence.” Fed speak for “no rush” to cut.
This Fed perspective on potential sticky inflation levels is reflected in the CME Group’s FedWatch Tool, now forecasting a 46% probability of a one-quarter percent cut in September with a higher probability in November. As to corporate earnings during this monetary policy “quiet phase,” companies appear to be weathering the rate storm. Earlier released Q1 earnings are indicating year-over-year growth rates of 3.5%, according to FactSet data, and net profit margins are trending towards 11.5%. For the full calendar year 2024, analysts are projecting earnings growth of 10.8%.
The Consumer’s Impact
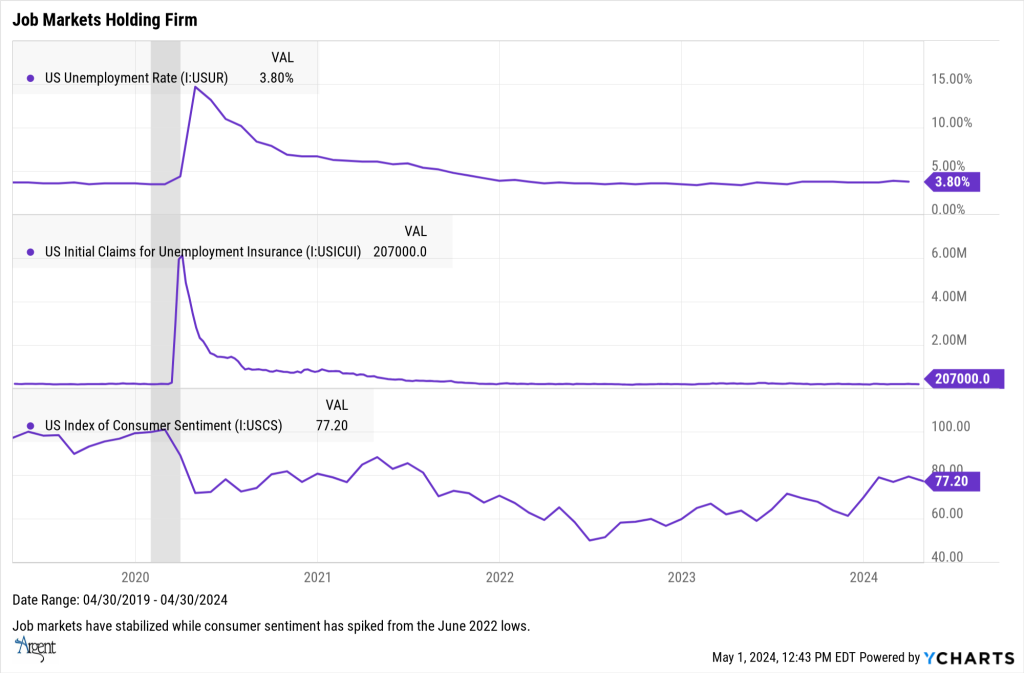
The employment picture remains positive, with unemployment levels stabilizing at 3.8% and both initial and continuing unemployment claims holding steady. There also appears to be plenty of labor slack that would potentially absorb any resilience in labor demand. Wage costs have also slowed, in turn lessening pressure on inflation concerns.
Also noteworthy is the current Michigan Consumer Sentiment reading. Since its index low reading of 50 in July 2022, the sentiment index has spiked by 55% to its current 77.2 level. According to Bespoke data, it is one of the three largest two-year sentiment recoveries since 1978.
Sticky Inflation
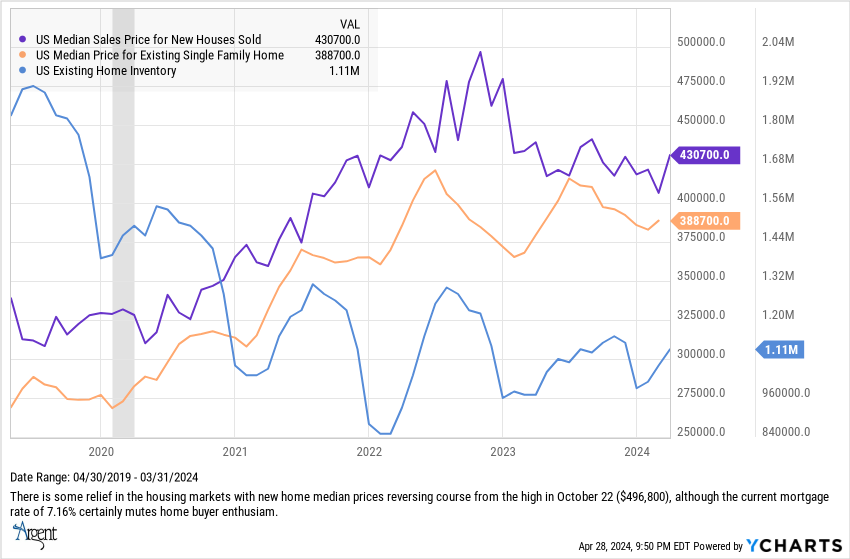
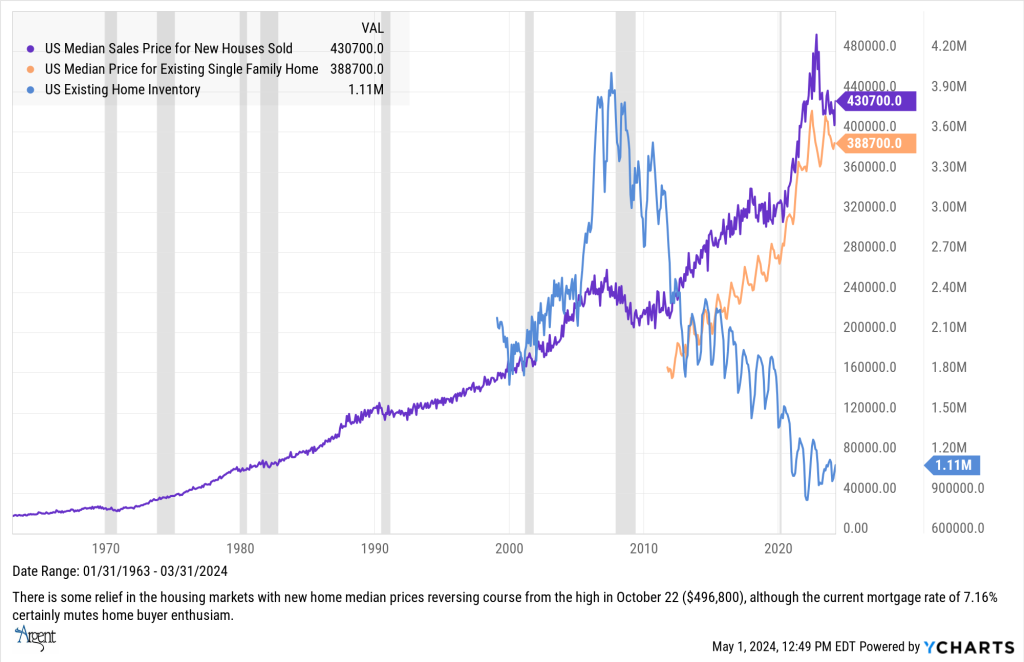
Housing remains one of the more visible pillars of inflation impact. Mortgage rates still reflect the volatility of fluid interest rate expectations but given the declining inventories over the past two years, home prices have managed to push higher, even in tandem with rising prices. Although the housing news for March continues to send mixed messages, there is some reason for hope regarding both inventory levels and housing prices over the balance of the year. The negatives first:
- Builder permits fell by 4.3% in March versus the prior month. Single- family units fell the most, 5.7% versus multi-family units down -1.2% (more weather related).
- Existing home sales were also off by 4.3% for the month, the steepest drop since November 2022.
- The median home sales price in March was $393,500, representing the 9th consecutive monthly increase. Cash sales represented 28% of home purchases versus February’s cash-for-house purchases of 33%.
- Mortgage rates are now up to 7.19%.
The positives:
- Pending home sales (contracts signed) were up by 3.4%, according to the National Association of Realtors and represented the best uptick this year.
- New home sales rose by 8.8% during the month of March (sales primarily comprised of homes under construction or homes completed, the latter being up 20% year-to-date).
- 22% of the Home Builders discounted their home prices in April, versus 24% in March and 36% of the builders in December.
- Inventories of new homes are expected to rise throughout the year, which should help stabilize prices, especially for new home construction.
- The big issue for existing homes is that until mortgage rates begin to decline, homeowners are hesitant to see and move into a higher mortgage rate. This keeps existing home inventory low and prices at their current levels. New home prices will be more negotiable as new supplies come to the market.
Markets Waiting for a Signal
April tends to be one of the more positive returns in the year. Dating back to 1928, the average return was 1.41%, and it was profitable 66% of the time. Unfortunately, this April has yet to beat the odds, with the market down 2.74% with two trading days left in the month.
With the S&P 500 having a difficult time through most of April, it’s not surprising that there were few safe harbors. From April 1 to April 26, the technology sector ETF (XLK) lost 4.32% and the financial sector (XLF) fell 2.55%. The few exceptions were the energy sector (XLE), up 0.66% and gold (GLD), up 4.23%.
There were reasons to be concerned earlier in the month as the S&P began selling off, and by April 4, initial support at the 20-day moving average had been broken. This was again tested unsuccessfully at the 50-day moving average, which failed to hold up the market price level. What was disconcerting was that such breakthroughs are often followed by a weakened market environment. This was the case last year between September 13 until November 3, 2023. This breakthrough also provided a number of warning signals throughout 2022.
At last week’s end, it appeared that investors were hanging in and bidding the markets back up, starting to reverse the sell-off earlier in April. As of last Friday, the S&P 500 is still down about 5% from its all-time March high. A point that underscores the outlook for stocks and bonds are not as positive as they were earlier in the year, dynamics changed by the Fed’s wait-and-see approach with interest rate cuts. Although there are still a number of headwinds ahead that have already been mentioned, the most obvious being the pushback by the Fed on near-term rate cuts. In the meantime, supporting positives for the markets include:
- Economic growth remains resilient, helping counter delayed rate cut expectations.
- The economy is not at risk at this point, but still has momentum-that is the conundrum for the Fed (warranting the question of whether another rate cut is imminent). In all likelihood, the next Fed cut will still be a matter of “when”-not “if”.
- Although Q1 GDP growth data was below expectations, the 1.6%annualized growth rate was still solid and likely subject to upward revision on May 30.
- Housing inflation headwinds should resolve itself over the next several months as new construction helps loosen supply issues, potentially dampening further escalating house prices. Multi-house unit completions continue to grow which will also help dampen /reverse rent inflation trends.
- Corporate earnings are expected to continue to improve through next year, providing an economic base for continued stabilization in job and wage growth, and market support.
Not Investment Advice or an Offer -This information is intended to assist investors. The information does not constitute investment advice or an offer to invest or to provide management services. It is not our intention to state, indicate, or imply in any manner that current or past results are indicative of future results or expectations. As with all investments, there are associated risks and you could lose money investing.

