


BY: Tom Stringfellow, CFA®, CPA®, CFP®
Chief Investment Strategist
Four Years In Context
• Service activity and job growth are signaling a further expansion of GDP growth in Q1 2024 with the GDPNow model indicating an annualized 3.2% growth rate.
• Since the beginning of November 2023 through February 23, 2024 the S&P 500 has risen nearly 20%, hardly a recessionary warning.
• Investor expectations for future rate cuts in 2024 might be a bit more ambitious than the Fed’s three-cut projection.
• Consumer sentiment measured by the Michigan Consumer Index jumped to a reading of 79.6, again the highest since July 2021.
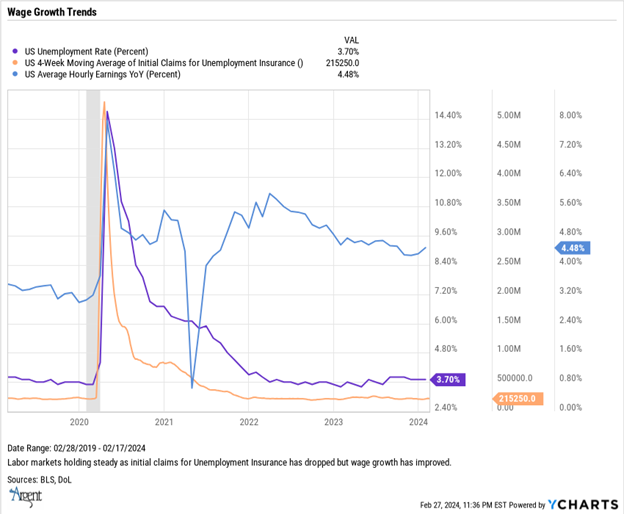
• The employment rolls continue to stabilize the economy, with unemployment levels still holding at 3.7%.
• Covid four years later, and the economy is holding steady.
The Four Year Post Covid Cycle
Four years ago last week (February 19, 2020) marked the anniversary of the S&P 500 peak’s closing just days before the global COVID-19 pandamonium shut down the world’s markets and economies.
In the week following, the S&P fell nearly 13%, and by March 23, 2020, the S&P had dropped nearly 34% from its peak 25 days earlier. Over the next four years, global populations would begin extended quarantines, daily life disruptions, global supply chain hurdles and of course, countless pandemic-related deaths. Add geopolitical stress and the Russian invasion of Ukraine; it’s rather surprising the global economies fared as well as they had four years later.
Today, the economic picture is much improved from the early pandemic days. While life pre- and post-pandemic remains a blur for many, life continued, and most economies have (or are in the process) of restarting. During the four year interim, however, global banks flooded the economies with liquidity, supporting commerce, homeowners, wage-earners and the markets with the necessary backstop to forestall what might have developed into a far worse and extended recession.
As Fed Funds rates quickly dropped, this set a floor in the markets and contributed to the upward inflating of markets, risk assets and of course, housing prices. Job markets also quickly tightened, dropping unemployment levels to near historic levels while continuing to prime wage growth.
But accommodative price policies weren’t without cost. Between March 2020 and January 2022, the average annual inflation rate rose to 6.34%, according to the Bureau of Labor Statistics, resulting in an 11% price increase as measured by the Consumer Price Index. The CPI Index rose to 9.1% in June 2022 alone, and food and energy prices soared. Russia’s invasion of Ukraine only exacerbated the problem. As food, fuel and housing prices rose, so did recessionary fears. The Fed then responded by tightening shorter-term rates, reversing earlier accommodate monetary policies, and hiking rates eleven times between March 17, 2022, and July 26, 2023.
Markets and economies today are now supported by speculative timing of the next FOMC pivot, with investors projecting numbers of rate cuts ahead. Expectations for six or seven rate cuts this year have waned; however, they have been replaced by musings that only three cuts might be in place by year’s end. While markets have so far withstood Fed rate cut delays over the next three to four months, the outsized risk today is a function of investor patience.
But despite the growing concerns that the Fed may be hedging the timing of rate cuts, the S&P has already rallied over 20% since the end of October 2023. This prompts the question of whether the market has already fully priced in the benefits of any future cuts. Over the past several days, we have heard from a number of key policymakers on this very topic. A few of the Fed speakers are fairly neutral in their outlook, but several policymakers are taking a more hawkish approach, further questioning the timing of the next rate cut. Fortunately, further hikes appear to be off the table.
Inflation Taming
The rise of inflation shortly after the quick reopening of the post-pandemic economy was a shock to the financial system. There were a number of immediate issues that impacted prices in the early months of restarting the economy, many of which were the result of shutting down and restarting the global economies over a few months time frame. The impact was felt throughout the manufacturing and supply chains, food, fuel and ultimately housing prices.
Over the past several months, however, inflation expectations have been improving. Declining natural gas prices have provided some relief in utility bills, and expectations for housing rental prices are expected to slow in the near future, given the increasing construction of single and multi-family housing. Labor wages have yet to feel the impact of rising rates, but then again, that and job growth have continued to be one of the strong underpinnings of this economy. But overall, the inflation trends have provided a base for the financial market’s momentum.
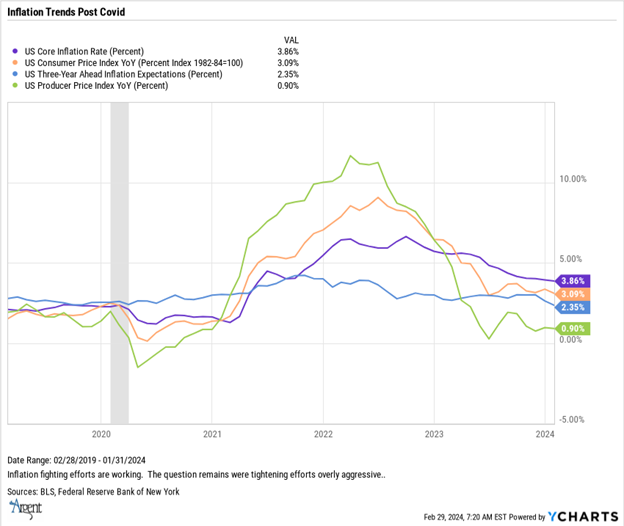
We are well off the inflation peaks when comparing both CPI and Core inflation (excluding food and fuel prices) to 2022. While the Federal Reserve’s inflation goal is closer to 2 to 2.5%, we continue to see improvements. January’s Consumer Price Index posted a 3.1% annual growth rate, which had fallen from the prior month’s 3.4%. What has been a bit more unsettling for the markets though, is the still “sticky” Core Inflation rate, posting an annualized increase of 3.9%.
The good news, however, is that the index measuring wholesale inflation at the producer level, Producer Price Index (PPI), posted a January annualized increase of 0.9%, well below the June 2022 record of 11.2%. Inflation pressures have indeed eased. While the reports aren’t quite where the Fed’s goals fall, inflation increases are beginning to trend back to levels pre-pandemic.
Services Industry Rebound
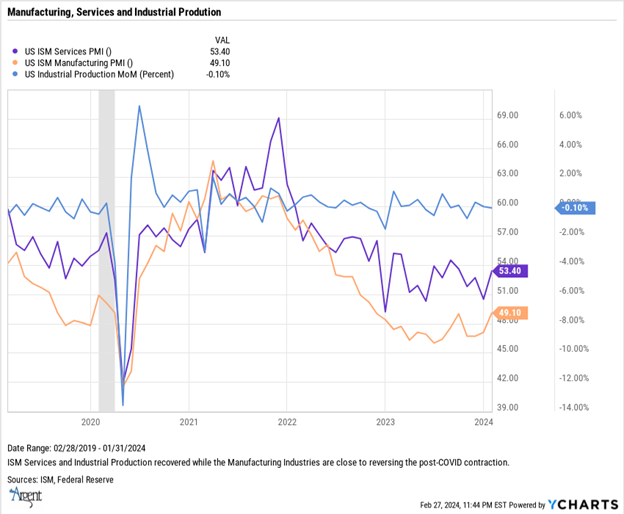
The overall landscape in the manufacturing sector is improving, although certainly not at the level of the pre-pandemic era. Recalling that in the early weeks and months of the economic quarantine, activity went to near-zero. When markets began opening up, growth rates jumped, especially evident in the month-over-month increase in industrial production. This was followed by a surge in manufacturing as several facilities restarted to replenish the growing demand for consumer products.
The growth in this demand has tapered off as consumers have slowed purchases of consumer goods. The slowdown in this category can certainly be attributed to higher interest rates (credit card debt) but also to the increase in out of home experiences (travel, dining and other leisure spending). Overall economic growth has been impressive, as consumers have redirected their spending. The latest data from Atlanta’s Fed GDPNow model forecast is an expected annual GDP growth rate for this first quarter of 2024 of 3.2%. This is just slightly below the first estimate of the fourth quarter GDP growth rate of 3.3%.
The services industry is holding up especially well, having jumped from a reading of 50.5 to 53.4, a substantial increase above consensus estimates. New orders, business activity and employment are all positive. While the index is still shy of pre-pandemic levels, this can be attributed to labor shortages in the service industry and the still slower rebuilding of the service industry demand.
Also worth noting is that while the manufacturing industry index is still sitting below 50 (considered contraction territory), at a reading of 49.1, it is at its highest level since October 2022. Contributors included the new orders index, which jumped to its highest level in almost two years. Meanwhile, the Dallas Fed Manufacturing PMI improved, with respondents upbeat on the outlook, with the future business activity index climbing to +6.2, the highest level since March 2022.
Respondents are even more upbeat about their own company outlook; this measure rose to +11.8, the highest since February 2022. The Richmond Fed’s Manufacturing Activity Index also rose to a three-month high in February. Like the Dallas Fed’s survey, price pressures were stable while employment was able to rebound into positive territory, rising to +7, the best level since October.
The Consumer-Four Years Later
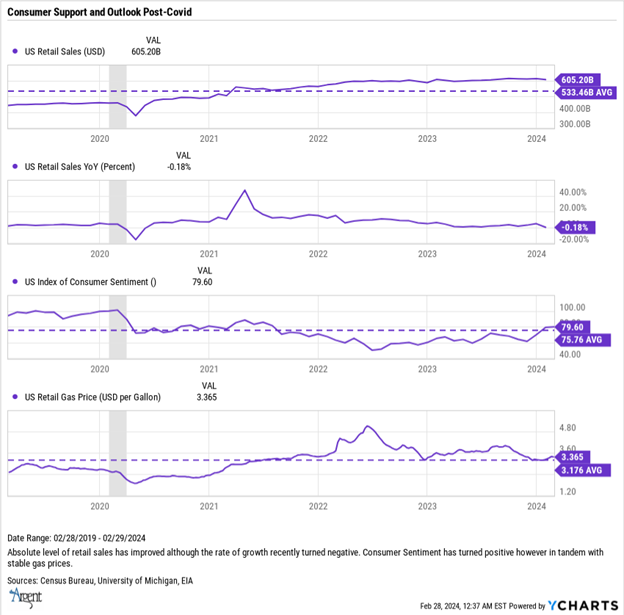
The consumer appears to be a bit more upbeat, with the Conference Board reading 114.8, the highest since December 2021. The two-year high reading was also mirrored in the University of Michigan’s recent January posting of 79.6. As noted by Bespoke Research, this is the first time in six years that both surveys hit a “two-plus-year high.”
Again, while confidence readings are still below those pre-pandemic, consumer outlook has continued to improve in tandem with the stable job market, wage growth, reasonable gas prices and certainly in tandem with the equity markets. And while we have seen a decline in year-over-year retail sales growth, remember this is still following the post-pandemic retail sales boom period. Overall sales growth since 2020 has been rather resilient, especially within online, restaurants, bars and travel categories.
Housing Market Trends
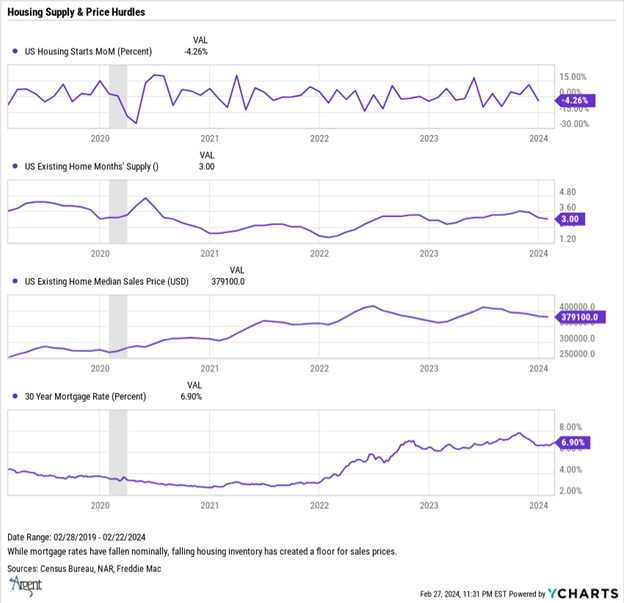
A few charts remind us of the story since 2020.
- Mortgage rates are up as a function of interest rate increases.
- Home prices are up as a function of limited inventory.
- Housing inventory is down as a function of limited building and housing turnover (homeowners selling and moving to the next house).
- Builders weren’t building over concerns of the economy’s direction.
The positive news is that for “existing” homeowners, despite mortgage rates close to 7%, according to Franklin Templeton, the average rate that most consumers are paying is 3.7%. This given the number of purchases and refinancing when rates were considerably lower in 2021-22.
Regarding the outlook for 2024, stable to falling rates and an improving economy will further boost builder confidence, new permits and construction. Falling rates will motivate buyers. What has been unique about this economic cycle is that housing demand slipped given rates and supplies, not a financially distressed consumer.
The Engine of Economic Growth
Jobs and wages. Since the pandemic, job growth has upheld the consumer’s ability to buy goods and pay rent. The number of people applying for unemployment benefits fell to a one-month low of 212,000. And in that backdrop, nonfarm payrolls rose in January at the fastest pace in a year. Compared to the pre-pandemic era:
- Unemployment levels remain near historic lows
- Average hourly wage growth is higher
- The four-week moving average of initial claims for unemployment is comparable
Overall, the employment picture continues to be the growth engine for the economic revival post-pandemic.
Inflation Defying Markets
Investors are bullish these days. This past week ending February 26, stocks surged to new highs, with the S&P 500 briefly hitting the 5,100 index level on an intraday move. Looking back over the past four year period, the markets have weathered quite a few volatile storms, including grain and oil price spikes following Russia’s invasion of Ukraine. Add rising interest rates, recession fears and broken supply chains post-Covid, and the market moves have been rather phenomenal.
While not all markets overseas have participated in the “melt-up” post-Covid, high marks go to India (up nearly 72%) and Mexico (up nearly 56%). The biggest detractor, however, was China, down nearly 14% and Hong Kong, off nearly 24%. Here in the U.S., investor sentiment is nearly “off-the-charts.” The CNN Fear/Greed Indicator is in
the “extreme greed” category, as is the AAII Investor Sentiment Survey, which, with a 44% reading, is in the “extremely bullish” category.
There are a number of factors continuing to drive today’s markets, including:
- Continuing expectations that inflation will fall
- The Federal Reserve will bring down interest rates
- Bond yields will continue declining
- Corporate earnings estimates will continue ratcheting upwards
- And last, the implied recession risks from still inverted yield curves will be bypassed.
At this point, it will be a few more months and several more data points to see how investors have fared in their assumptions. From my perspective, however, we will continue to see relief in those inflationary pressures which today is primarily in housing. Relief will come via more confidence that the economy has stabilized and that mortgage rates will begin to come back down to pre-pandemic levels.
As to corporate earnings, estimates are beginning to rise, which should reaffirm the more optimistic market outlook. According to data from FactSet, earnings growth for calendar year 2024 is expected to be 10.9%, with revenue growth of 5.4%. In the meantime, the percentage of S&P 500 stocks trading above both their 50- and 200-day averages is well off its prior lows. A must to have broad participation in the market revival.

Parting Thoughts
- The S&P 500 began its “bull-market” recovery on October 12, 2022, having now risen by nearly 42% over the past 504 days. As noted by Bespoke Research, this is still a distance from the average bull market gains of 114% or a median gain of 76%.
- Year four of the Presidential Election Cycle has been the second strongest of the four year cycle for the S&P 500.
- Since 2022 and 2023, the combined headwinds from rising Treasury Yields, the Dollar index and the price of oil were obvious market detractors. Today, all three headwinds are in the rearview mirror.
- Headwinds remain, however, with the poor housing affordability. October data from Case Shiller indicates that costs to cover a median house at prevailing mortgage rates were at their highest level since 1990. On the flip side, mortgage rates are ticking down and home prices are beginning to moderate.
- According to the Bureau of Economic Analysis, initial GDP estimates for Q4 2023 increased at an annual rate of 3.3%. In the third quarter, real GDP increased 4.9% percent. Most recent estimates from the Atlanta Fed’s GDPNow pegs Q1, 2024 growth rates closer to 3.2%. While this level of growth may cause the FOMC policymakers to rethink further rate cuts, the data does not suggest an imminent recession.
- According to Bespoke Research, the U.S. Stock market moves over the past four years have actually been fairly average when comparing rolling four year changes since the SPY’s inception back in 1993. The average rolling four year average back 30 years is 43% versus this past four year’s price change of 47%.
Not Investment Advice or an Offer -This information is intended to assist investors. The information does not constitute investment advice or an offer to invest or to provide management services. It is not our intention to state, indicate, or imply in any manner that current or past results are indicative of future results or expectations. As with all investments, there are associated risks and you could lose money investing.

